Ontario Securities Commission Bulletin
Issue 47/17 - April 25, 2024
Ont. Sec. Bull. Issue 47/17
• Trilogy International Partners Inc.
• Polaris Financial Inc. and Quintessence Wealth
• Ninepoint Partners LP and Canadian Large Cap Leaders Split Corp.
• Temporary, Permanent & Rescinding Issuer Cease Trading Orders
• Temporary, Permanent & Rescinding Management Cease Trading Orders
- - - - - - - - - - - - - - - - - - - - - - - - - - - - - - - - - - - - - - - - - - - - - - - - - -
FOR IMMEDIATE RELEASE
April 22, 2024
TORONTO -- The Tribunal issued an Order in the above-named matter.
A copy of the Order dated April 22, 2024 is available at capitalmarketstribunal.ca.
For Media Inquiries:
For General Inquiries:
FOR IMMEDIATE RELEASE
April 23, 2024
TORONTO -- A case management hearing in the above-named matter is scheduled to be heard on April 23, 2024 at 4:30 p.m. by videoconference.
Members of the public may observe the hearing by videoconference, by selecting the "Register to attend" link on the Tribunal's hearing schedule, at capitalmarketstribunal.ca/en/hearing-schedule.
For Media Inquiries:
For General Inquiries:
File No. 2022-19
Adjudicators: |
Andrea Burke (chair of the panel) |
James Douglas |
|
Cathy Singer |
April 22, 2024
WHEREAS on April 19, 2024, the Capital Markets Tribunal concluded the evidentiary portion of the merits hearing in this proceeding;
ON HEARING the submissions of the representatives for the Ontario Securities Commission, TeknoScan Systems Inc., Philip Kai-Hing Kung and Soon Foo (Martin) Tam, and of H. Samuel Hyams, appearing on his own behalf;
IT IS ORDERED THAT:
1. the Commission shall serve and file written closing submissions on the merits by 4:30 p.m. on May 14, 2024;
2. each of the respondents shall serve and file written closing submissions on the merits by 4:30 p.m. on May 28, 2024; and
3. oral closing submissions on the merits shall be heard on May 31, 2024, at 10:00 a.m. at the Capital Markets Tribunal located at 20 Queen Street West, 17th Floor, Toronto, Ontario, or as may be agreed to by the parties and set by the Governance & Tribunal Secretariat.
A Post-Implementation Review of the Impacts of the CRM2 Annual Costs and Performance Reports on Investment Fund Fees and Performance
The Executive Summary, A Post-Implementation Review of The Impacts of The CRM2 Annual Costs and Performance Reports on Investment Fund Fees, and A Post-Implementation Review of the Impacts of the CRM2 Annual Costs and Performance Reports on Investment Fund Performance, are reproduced on the following internally numbered pages. Bulletin pagination resumes at the end of the reports.
The CSA has undertaken research to examine the post-implementation impacts of the final phase of the Client Relationship Model (CRM2) amendments to National Instrument 31-103 Registration Requirements, Exemptions and Ongoing Registrant Obligations (herein after the CRM2 annual costs and performance reports) on industry and investor behaviour.
The final amendments, which came into effect on July 15, 2016, were designed to ensure investors receive clear and complete annual disclosure of both the performance of their investments and of all fees associated with their accounts, including registrant compensation. The detailed findings of this research are presented in the following reports{1}:
• A Post-Implementation Review of The Impacts of The CRM2 Annual Costs and Performance Reports on Investment Fund Fees (Fees Report)
• A Post-Implementation Review of the Impacts of the CRM2 Annual Costs and Performance Reports on Investment Fund Performance (Performance Report)
This document provides a high-level summary of the research findings. The findings presented in this executive summary and the research reports are the views of CSA staff and are for informational purposes only. As such, statements made in these documents do not represent the CSA's views of any official policy position.
The increased disclosure of fees and performance brought about by the CRM2 amendments is expected to have enabled retail investors to make better investment decisions and promoted efficient markets. As a result, we hypothesize that this greater transparency has led to more competitive fund pricing and higher performance by investment funds.
To test our hypothesis, we undertook a study to examine whether the enhanced reporting of investment cost and performance led to changes in mutual fund and exchange-traded fund (ETF) fees{2}, product creation, product distribution, and fund performance.
In particular, we asked:
1. Have investment fund managers (IFMs) lowered fees, specifically management expense ratios (MER) and management fees, and what is the extent of these changes?
2. Have product manufacturers and product distributors been shifting to products that are not captured by the new account costs and performance disclosures?
3. What have been the changes in product creation and distribution trends?
4. Has greater transparency about investment returns led to IFMs improving the risk-adjusted performance of their mutual funds and ETFs?
The research covers January 2013 to December 2020. This time period begins about 18 months before the first set of CRM2 amendments came into effect on July 15, 2014 (cost disclosures related to pre-trade disclosure of charges, and trade confirmation for debt securities). The 2013 start date gives us a baseline for the investment fund industry before the first set of CRM2 amendments were implemented. We hypothesize that the changes we are seeking to measure took place several years after the CRM2 annual costs and performance reports were fully implemented. Considering this, the study timeline extends to 2020 to account for this time lag, enabling us to more fully observe the extent of any changes. Our analysis groups the findings into three time periods: 2013 to 2020, which is the overall duration of our study period, the pre-implementation period of 2013 to 2016 and the post-implementation period of 2017 to 2020.
The research findings suggest that overall industry behaviour has been shifting in directions that are consistent with our hypothesis on the impact of the CRM2 regulations. This helps provide evidence that disclosure-based regulations may be an effective tool in changing industry and investor behaviour.
Our findings provide important directional trends (i.e., correlation rather than cause and effect outcomes). It is possible that other factors, which we could not practically account for in our analysis, also contributed to the changes we are highlighting.
We caution readers from drawing conclusions that the changes presented in this report were caused solely by the CRM2 annual costs and performance reports.
Research question 1: Have investment fund managers (IFMs) lowered fees, specifically MERs and management fees, and what are the extent of these changes? |
There were declines in the asset-weighted average MERs and management fees, for both mutual funds and ETFs, during our study period, and the extent of these changes varied by investment fund type and fund characteristics.{3},{4}
Overall, the asset-weighted average MER declined by 38 basis points (or 19%) over 2013-2020 for our study sample, and between 13 and 49 basis points, or between 6% and 30%, across the main fund characteristics examined.{5} The size of the asset-weighted average management fee declines was smaller, at 29 basis points for the overall study sample and ranged from 6 to 39 basis points across the main fund characteristics, or between 4% and 32%.
Changes in the asset-weighted average MERs and management fees were generally greater during the post-implementation period than the pre-implementation period. Declines in the asset-weighted average MERs and management fees across the fund characteristics examined ranged from 3 to 19 basis points, or 2% to 15%, for both time periods.
Both shifts in the distribution of assets towards mutual fund series with lower fees, and reductions in series' MERs and management fee rates, contributed to lowering the asset-weighted average MERs and management fees.{6}
However, shifts in the distribution of assets had a larger effect than reductions in MER/management fee rates in lowering the aggregate asset-weighted average MERs/management fees for both time periods.
ETFs, compared to mutual funds, had smaller declines in their asset-weighted average MERs and management fees during our study period. This finding was anticipated since the MERs and management fees for most ETFs started from a lower baseline level. This is primarily because the majority of ETF assets are invested in funds that employ a passively managed investing strategy.
By the end of our study period in 2020, the asset-weighted average MER for our study sample had declined by 8 basis points (or 21%) from 2013 levels, and between 6 and 11 basis points or between 12% and 34%, depending on the fund characteristic examined. The decrease in the overall asset-weighted average management fee was 7 basis points (22%) between 2013 and 2020. Across the main fund characteristics, the declines in asset-weighted averages ranged from 3 to 10 basis points, or 5% to 34%.
Changes in the asset-weighted average MERs and management fees during both the pre- and post-implementation periods ranged from +1 to -8 basis points or +1% to -19% across the fund characteristics examined. There were no strong directional trends in the asset-weighted average MER/management fee declines by fund characteristics. Both changes in the distribution of assets and reductions in MERs and management fee rates had a broadly similar contribution to lowering the asset-weighted average fees, in both the pre- and post-implementation periods.{7}
Research question 2: Have product manufacturers and product distributors been shifting to products that are not captured by the new account costs and performance disclosures? |
Our analysis of Canadian household discretionary financial assets did not show a trend of discretionary financial assets moving towards products not captured by the CRM2 annual costs and performance report requirements.{8}
Between 2013 and 2020, the share of discretionary financial assets held in deposits remained stable at 27%. Meanwhile, the share of assets in non-investment fund securities increased slightly, from 25% to 26%, and the share of assets in investment funds increased from 28% to 32%. For investment funds, the 4 percentage point share increase was the result of growing market shares for mutual funds and ETFs.
Research question 3: What have been the changes in product creation and distribution trends, generally? |
Five notable changes in product creation and distribution occurred during our study period. Unless otherwise noted, the findings and figures discussed below are for the overall industry and are not only for our study sample.
The continued popularity of fund wrap programs contributed to a rise in the number of fund-of-funds products, for both mutual funds and ETFs{9}. This was evident in the shift of assets away from stand-alone funds to fund-of-funds products. In 2013, 26% of mutual fund assets were in fund-of-funds products and by 2020 this figure had increased to 37%. One of the largest ETF manufacturers introduced ETF-of-ETFs products in early 2018. By December 2020, ETF-of-ETFs products accounted for $6 billion or 2% of the total industry ETF assets.
Growth of the ETF market was evident during our study period, and the growth rate for ETFs substantially surpassed the growth rate for mutual funds. Between 2013 and 2020, the annual growth in the number of ETFs was 17% while it was 2% for mutual funds.
Within ETF creation, one of the most significant changes that occurred during our study period was the rise of actively managed and strategic beta ETFs.{10} Near the start of our study period, actively managed and strategic beta ETFs accounted for 23% and 17% of the number of ETFs according to data from Investor Economics. By December 2020, their respective share rose to 43% and 21%. The rise in the number of strategic beta ETFs did not lead to a corresponding rise in ETF assets in that category of funds. In contrast, the share of ETF assets in actively managed ETFs increased from 9% at the start of our study period, to 24% by the end of our study period.
Within the mutual fund market, the shift from commission-based to fee-based series was pronounced during our study period. Between 2013 and 2020, the number of fee-based series increased by 186%, from 2,592 to 7,404. In comparison, the number of commission-based "A-series," which is the "core" mutual fund series, increased by 103% from 2,887, in 2013, to 5,880, in 2020.
Looking at our study sample, we found that 6% of mutual fund assets were in fee-based series at the start of our study period in 2013. This figure increased to 27% by the end of our study period in 2020. The growth and shift of assets into fee-based series corresponded with declining assets in commission-based A-series. In 2013, 75% of our study sample assets were in A-series and by 2020 this figure had declined to 58%.
A product creation trend that occurred towards the end of our study period was the rise of and demand for funds with an environmental, social, and governance (ESG) mandate. There were 49 mutual funds with an ESG mandate in 2013 and these funds had assets of $5.1 billion. By 2020, the number of mutual funds with an ESG mandate almost doubled to 97 funds. The number of ETFs with an ESG mandate grew from 10 in 2018, to 50 by 2020. Despite the significant increase in the number of funds with an ESG mandate, their share of total industry assets is small. In 2020, funds with an ESG mandate accounted for around 1% of total industry assets within the mutual fund and ETF markets, respectively.
A new direct to investor/consumer distribution channel emerged in 2014 with the launch of four online advice platforms -- Wealthsimple, Wealth Bar, NestWealth, and Questwealth Portfolios. These platforms provide retail investors with access to discretionary asset management services with no or low account size minimum requirements. These platforms invest client assets primarily in ETFs, and to a lesser extent in mutual funds, other redeemable investment funds, cash, and cash equivalents.{11} By the end of 2020, 22 online advisers operated in Canada. These firms had an estimated $10 billion in assets under management, which is equivalent to about 4% of the industry total assets for ETFs.
Research question 4: Has greater transparency about investment returns led to investment fund managers improving the risk-adjusted performance of their mutual funds and ETFs? |
On balance, we find that the risk-adjusted performance relative to our model's benchmark for both mutual funds and ETFs, while remaining negative for the whole study period, improved in the years after the client statements, annual costs and performance reports were implemented.{12}
Our research findings are based on a fund sample representing approximately 62% of mutual funds and ETFs in the Canadian market, as measured by assets under management (AUM) in December 2020.
We use total return and risk-adjusted return, also known as alpha, as measures of fund performance, and report results based on gross returns (i.e., returns before fees and expenses).{13}
The annualized average gross total returns between 2013 and 2020, for our study sample, were 7.1% for mutual funds and 7.9% for ETFs. Accounting for fund risks, we found that the mean gross alphas relative to our model benchmarks were -3.5% for mutual funds and -2% for ETFs. These negative alphas imply that, on average, the total returns are lower than what would be implied by our chosen benchmark used to account for fund risks.{14}
Comparing the performance findings for the pre- and post-implementation periods, we found that the risk-adjusted returns relative to our model benchmarks improved during the post-implementation period, even though they continued to remain negative. For mutual funds, the annualized average gross alpha was -5%, between 2013 and 2016, and -2.2% between 2017 to 2020. The ETF findings were -4.8% for the pre-implementation period and -0.6% for the post-implementation period.
Our research also analyzed whether there were differences in fund performance by the following fund characteristics: asset class, investing strategy, product type, and IFM type. The findings by fund characteristics directionally mirrored the overall findings but the annualized average gross total return and risk-adjusted return varied by fund characteristics.
There were no uniform directional trends for the gross total returns when we compared the pre- and post-implementation results. Between these two time periods, returns increased for some fund characteristics and decreased for others. The gross total returns ranged from 1% to 10.8% for mutual funds, and 1.4% to 11.2% for ETFs.
{1} The reports have benefited greatly from comments from internal and external peer reviewers. They include J. Ari Pandes, Haskayne School of Business, University of Calgary, and reviewers from The Investment Funds Institute of Canada (IFIC) and ISS MI Investor Economics. Any remaining errors of fact or interpretation are the sole responsibility of the authors.
{2} Our study is focused on the management expense ratio (MER) and management fees because the MER is an ongoing cost levied annually, and the components of the MER are relatively consistent across asset classes for the same (mutual fund) series type. The MER consists of the management fee paid to the fund's investment manager, trailing commissions paid investment advisors and/or dealers, operating expenses and taxes. For more information, see https://www.getsmarteraboutmoney.ca/learning-path/mutual-funds-segregated-funds/mutual-fund-fees/
{3} Asset-weighting the average MER or management fee is a way to calculate the average fee paid by investors which gives more weight to the fees charged by investment funds that manage more assets. We use this measure as it better reflects the average fees paid by investors than a simple average.
{4} Our analysis of fees examined the changes in MER and management fees across the following fund characteristics: asset class, fund product type (mutual funds only), fund investment strategy, IFM firm type, and series/class type.
{5} The analysis in the body of the report focuses on fund characteristics that account for the majority of mutual fund and ETF assets.
{6} Series with all levels MER/management fee rates saw both increases and decreases in their asset shares during our study period. However, on average, asset shares of series with lower MER/management fee rates grew more than asset shares of series with higher MER/management fee rates, and this contributed to lowering the asset-weighted average fees.
{7} Ibid.
{8} Investor Economics defines discretionary financial assets as financial assets where households hold the decision-making power with regards to the deployment of these monies into specific investment vehicles.
{9} Investor Economics defines fund wrap programs as those that use investment funds as building blocks. These can include segregated funds of funds, mutual funds of funds, packaged fund wraps and high-end fund wraps.
{10} Strategic beta ETFs are funds that apply rules to a basket of securities (often represented by an index) to target companies that demonstrate specific "factors" such as value, momentum, or growth. Strategic beta ETFs are also known by other names such as smart beta or alternative beta. There is no universally accepted view as to whether strategic beta ETFs are passively managed investment funds or actively managed investment funds. For the purpose of our research, we have classified strategic beta ETFs as passively managed funds because they focus on a specific basket of securities often represented by indices.
{11} Redeemable investment funds generally allow investors to purchase or redeem securities of mutual funds on demand for a price representing a proportionate interest of the fund's net assets. Mutual funds are the main type of redeemable investment fund.
{12} Note that risk-adjusted performance is measured relative to our chosen benchmarks based on the Fama and French (2015) model. Negative risk-adjusted performance of a fund indicates that the fund underperformed the benchmarks used to account for the fund risks in the model we have applied. It is important to highlight that a negative risk-adjusted return does not imply that investors incurred losses from investing in the fund during our sample period.
{13} Gross performance allows the analysis of funds' performance to be independent of their fees and expenses, which are analyzed separately in a companion report entitled A Post-Implementation Review of the Impacts of the CRM2 Annual Costs and Performance Reports on Investment Fund Fees. We have also assessed net performance and obtained qualitatively similar conclusions (results available upon request).
{14} See footnote 11 for some information on our chosen benchmark.
1. |
Introduction and a Summary of Research Findings |
3 |
|
|
1.1 |
Purpose and Background of Research |
3 |
|
1.2 |
Summary of Research Findings |
4 |
|
|||
2 |
Organization of Research Findings |
9 |
|
|
|||
3 |
Overview of Canadian Household Discretionary Financial Assets |
10 |
|
|
|||
4 |
Overview of Investment Fund Industry in Canada |
12 |
|
|
|||
5 |
Mutual Fund Fees Research Findings |
19 |
|
|
5.1 |
Overview of Mutual Fund Study Sample -- Assets, Returns and Fees |
19 |
|
5.2 |
Changes in the Overall Asset-Weighted Average MERs and Management Fees by Study Period |
20 |
|
5.3 |
Mutual Fund Fees by Broad Asset Class |
25 |
|
5.4 |
Mutual Fund Fees by Series Type |
29 |
|
5.5 |
Mutual Fund Fees by Product Type |
32 |
|
5.6 |
Mutual Fund Fees by Investing Strategy |
35 |
|
5.7 |
Mutual Fund Fees by IFM Firm Type |
37 |
|
|||
6 |
ETF Fees Research Findings |
41 |
|
|
6.1 |
Introduction |
41 |
|
6.2 |
Overview of ETF Study Sample -- Assets, Returns, and Fees |
42 |
|
6.3 |
Changes in The Overall Asset-Weighted Average MERs and Management Fees by Study Periods |
43 |
|
6.4 |
ETF Fees by Broad Asset Class |
44 |
|
6.5 |
ETFs Fees by Investing Strategy |
47 |
|
6.6 |
ETF Fees by IFM Firm Type |
50 |
|
|||
7 |
Conclusion |
53 |
|
|
|||
Appendix A -- Research Design and Fees Methodology |
55 |
||
|
1. |
Research Design |
55 |
|
2. |
Fees Methodology |
58 |
|
|||
Appendix B -- Explanation and Interpretation of the Fund Asset Weight Effect, the Price Effect, and the Interaction Effect |
60 |
||
|
|||
Appendix C -- Supplemental Data Tables by Report Sections |
66 |
||
Policy evaluation is crucial in the policy development cycle because it allows regulators to understand whether a newly introduced policy has been implemented as intended and is having the desired impacts and outcomes.
The purpose of this research is to examine the post implementation impacts of the final phase of the Client Relationship Model (CRM2) amendments to National Instrument 31-103 Registration Requirements, Exemptions and Ongoing Registrant Obligations (herein after the CRM2 annual costs and performance reports) on industry behaviour.
The final amendments, which came into effect on July 15, 2016, were designed to ensure investors receive clear and complete disclosure of the performance of their investments and all fees associated with their accounts, including registrant compensation, on an annual basis.
With increased transparency of fees and performance in the CRM2 annual costs and performance reports, we expect that investors have paid closer attention to the total cost of investing and the services received over time. We hypothesize that this increase in cost and performance awareness has led to more competitive product pricing (e.g., investment fund managers may lower fees on existing mutual fund series/classes) with knock on effects for risk-adjusted performance.
To test our hypothesis, we undertook a study to examine whether greater transparency about investment cost and performance has led to changes in mutual fund and exchange-traded fund (ETF) fees{2}, product creation, and product distribution. In particular, we asked:
1. Have investment fund managers (IFMs) lowered fees, specifically the management expense ratio (MER) and management fee, and what is the extent of these changes?
2. Have product manufacturers and product distributors been shifting to products that are not captured by the new account costs and performance disclosures, and
3. What have been the changes in product creation and distribution trends?
An accompanying research report entitled A Post-Implementation Review of the Impacts of the CRM2 Annual Costs and Performance Reports on Investment Fund Performance provides insights into whether IFMs have improved the risk-adjusted performance of their products as a result of the CRM2 annual costs and performance reports. The performance research tests our hypothesis that greater transparency of fees and performance has led to an increased demand from both investors and their advisers for funds with better risk-adjusted performance.
Research suggests that we should anticipate this outcome as a corollary of any reduction in fund fees.{3}
This fees report is focused on mutual funds and ETFs, but where appropriate other types of investment products, such as segregated funds, are also examined.{4}
Our fees analysis examines changes in MERs and management fees for the following mutual fund/ETF fund characteristics:
• asset class
• fund product type (mutual funds only)
• fund investing strategy
• IFM firm type
• series/class type (mutual funds only).{5}
We focused our analysis on these fund characteristics as there is a large body of research conducted by academics, industry, and regulators showing that these characteristics are significant in influencing fund expenses.
The study period covers January 2013 to December 2020. This time period begins about 18 months before the first set of CRM2 amendments came into effect on July 15, 2014 (cost disclosures related to pre-trade disclosure of charges, and trade confirmation for debt securities). The 2013 start date gives us a baseline of the investment fund industry before the first set of CRM2 amendments were implemented. We hypothesize that the changes we are seeking to measure took place several years after the CRM2 annual costs and performance reports are fully implemented. In light of this, the study timeline extends to 2020 to account for this time lag, enabling us to more fully observe the extent of any changes. Our analysis groups the findings into three time periods: 2013 to 2020, which is the overall duration of our study period, the pre-implementation period of 2013 to 2016 and the post-implementation period of 2017 to 2020.
The findings presented in this report are the views of CSA staff and are for informational purposes only. As such, statements made in the report do not represent the CSA's views of any official policy position.
Our findings provide important directional trends, i.e., correlation rather than cause and effect outcomes. As such, we caution readers from drawing conclusions that the changes presented in this report were caused by the CRM2 annual costs and performance reports.
It is possible that other factors, which we could not practically account for in our analysis, also contributed to the changes we are highlighting.
These factors include: advertising by firms competing on fees; local and national news stories focused on fees, cost effective investments, and the best interest discussion in Canada; increasing investor interest in passive investment funds and online advisers; and improvements in market conditions.
Keeping these limitations in mind, our research found that after the introduction of the CRM2 requirements:
• MERs and management fees decreased, for both mutual funds and ETFs in our study sample{6}
• there is no evidence that IFMs and product distributors have been shifting to products not subject to the CRM2 requirements
• there were market shifting changes in product creation and distribution. Most notable were the growth of the ETF market and actively managed and strategic beta ETFs, growth in fee-based mutual fund series, and the emergence of online advisers.
These findings suggest that industry behaviour, overall, has been shifting in directions that are congruent with our hypothesis on the impact of the CRM2 regulations, and help provide evidence that disclosure-based regulations may be an effective tool in changing industry and investor behaviour.
We further discuss the three generalized findings for each of our research questions by the study's three time periods, in the latter half of this section of the report. Sections 4, 5, and 6 of the report break down our research findings in greater detail, specifically by investment fund type, fund characteristics, and time periods.
This section of the report further discusses the three generalized findings for each of our research questions by the study's three time periods.
Research question 1: Have investment fund managers (IFMs) lowered fees, specifically MERs and management fees, and what are the extent of these changes? |
There were declines in the asset-weighted average MERs and management fees, for both mutual funds and ETFs, during our study period, and the extent of these changes varied by investment fund type and fund characteristics.
Overall, the asset-weighted average MER declined by 38 basis points (or 19%) over 2013-2020 for our study sample, and between 13 and 49 basis points, or between 6% and 30%, across the main fund characteristics examined.{7} The size of the asset-weighted average management fee declines was smaller, at 29 basis points for the overall study sample and ranged from 6 to 39 basis points across the main fund characteristics, or between 4% and 32%.
Changes in the asset-weighted average MERs and management fees were generally greater during the post-implementation period than the pre-implementation period. Declines in the asset-weighted average MERs and management fees across the fund characteristics examined ranged from 3 to 19 basis points, or 2% to 15%, for both time periods.
Both shifts in the distribution of assets towards mutual fund series with lower fees, and reductions in series' MERs and management fee rates, contributed to lowering the asset-weighted average MERs and management fees.{8}
However, shifts in the distribution of assets had a larger effect than reductions in MER/management fee rates in lowering the aggregate asset-weighted average MERs/management fees for both time periods.
ETFs, compared to mutual funds, had smaller declines in their asset-weighted average MERs and management fees during our study period. This finding was anticipated since the MERs and management fees for most ETFs started from a lower baseline level. This is primarily because the majority of ETF assets are invested in funds that employ a passively managed investing strategy.
By the end of our study period in 2020, the asset-weighted average MER for our study sample had declined by 8 basis points (or 21%) from 2013 levels, and between 6 and 11 basis points or between 12% and 34%, depending on the fund characteristic examined. The decrease in the overall asset-weighted average management fee was 7 basis points (22%) between 2013 and 2020. Across the main fund characteristics, the declines in asset-weighted averages ranged from 3 to 10 basis points, or 5% to 34%.
Changes in the asset-weighted average MERs and management fees during both the pre- and post-implementation periods ranged from +1 to --8 basis points or +1% to --19% across the fund characteristics examined. There were no strong directional trends in the asset-weighted average MER/management fee declines by fund characteristics. Both changes in the distribution of assets and reductions in MERs and management fee rates had a broadly similar contribution to lowering the asset-weighted average fees, in both the pre- and post-implementation periods.{9}
Research question 2: Have product manufacturers and product distributors been shifting to products that are not captured by the new account costs and performance disclosures? |
Our analysis of Canadian household discretionary financial assets did not show a trend of discretionary financial assets moving towards products not captured by the CRM2 annual costs and performance report requirements.
Between 2013 and 2020, the share of discretionary financial assets held in deposits remained stable at 27%. Meanwhile, the share of assets in non-investment fund securities increased slightly, from 25% to 26%, and the share of assets in investment funds increased from 28% to 32%. For investment funds, the 4 percentage point share increase was the result of growing market shares for mutual funds and ETFs.
Research question 3: What have been the changes in product creation and distribution trends, generally? |
Five notable changes in product creation and distribution occurred during our study period. Unless otherwise noted, the findings and figures discussed below are for the overall industry and are not only for our study sample.
The continued popularity of fund wrap programs contributed to a rise in the number of fund-of-funds products, for both mutual funds and ETFs; and, this was evident in the shift of assets away from stand-alone funds to fund-of-funds products. In 2013, 26% of mutual fund assets were in fund-of-funds products and by 2020 this figure had increased to 37%. One of the largest ETF manufacturers introduced ETF-of-ETFs products in early 2018. By December 2020, ETF-of-ETFs products accounted for $6 billion or 2% of the total industry ETF assets.
Growth of the ETF market was evident during our study period, and the growth rate for ETFs substantially surpassed the growth rate for mutual funds. Between 2013 and 2020, the annual growth in the number of ETFs was 17% while it was 2% for mutual funds.
Within ETF creation, one of the most significant changes that occurred during our study period was the rise of actively managed and strategic beta ETFs.{10} Near the start of our study period, actively managed and strategic beta ETFs accounted for 23% and 17% of the number of ETFs according to data from Investor Economics. By December 2020, their respective share rose to 43% and 21%. The rise in the number of strategic beta ETFs did not lead to a corresponding rise in ETF assets in that category of fund. In contrast, the share of ETF assets in actively managed ETFs increased from 9% at the start of our study period, to 24% by the end of our study period.
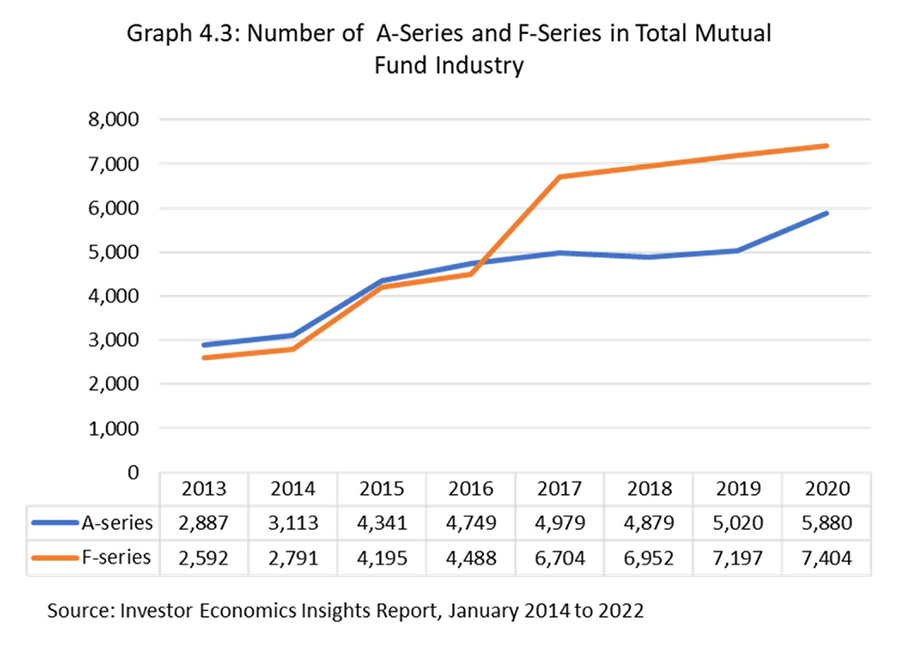
Within the mutual fund market, the shift from commission-based to fee-based series was pronounced during our study period. Between 2013 and 2020, the number of fee-based series increased by 186%, from 2,592 to 7,404. In comparison, the number of commission-based "A-series", which is the "core" mutual fund series, increased by 103% from 2,887, in 2013, to 5,880, in 2020.
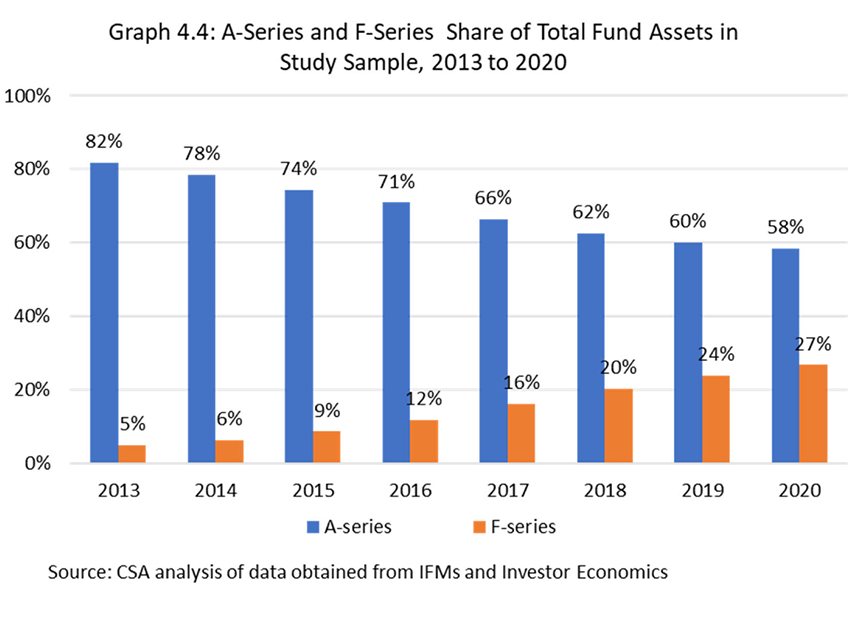
Looking at our study sample, we found that 6% of mutual fund assets were in fee-based series at the start of our study period in 2013. This figure increased to 27% by the end of our study period in 2020. The growth and shift of assets into fee-based series corresponded with declining assets in commission-based A-series. In 2013, 75% of our study sample assets were in A-series and by 2020 this figure had declined to 58%.
A product creation trend that occurred towards the end of our study period was the rise of and demand for funds with an environmental, social, and governance (ESG) mandate. There were 49 mutual funds with an ESG mandate in 2013 and these funds had assets of $5.1 billion. By 2020, the number of mutual funds with an ESG mandate almost doubled to 97 funds. The number of ETFs with an ESG mandate grew from 10 in 2018, to 50 by 2020. Despite the significant increase in the number of funds with an ESG mandate, their share of total industry assets is small. In 2020, funds with an ESG mandate accounted for around 1% of total industry assets within the mutual fund and ETF markets, respectively.
A new direct to investor/consumer distribution channel emerged in 2014 with the launch of four online advice platforms -- Wealthsimple, Wealth Bar, NestWealth, and Questwealth Portfolios. These platforms provide retail investors with access to discretionary asset management services with a substantially lower, if any, account size minimum requirement. These platforms invest client assets primarily in ETFs, and to a lesser extent in mutual funds, other redeemable investment funds, cash and cash equivalents.{11} By the end of 2020, 22 online advisers operated in Canada. These firms had an estimated $10 billion in assets under management, which is equivalent to about 4% of the industry total assets for ETFs.
Our research findings are organized along the following structure.
Part 3 of the report provides a high-level overview of Canadian household discretionary financial wealth and how this wealth is allocated by investment products. This section of the report discusses whether product manufacturers and distributors are shifting to products not subject to the CRM2 requirements.
Part 4 provides a high-level overview of the investment fund industry in Canada. This section of the report discusses in detail changes in product creation and distribution. Parts 3 and 4 of the report provide useful information to readers that puts the research findings into context and aids readers in their interpretation of the research results.
Part 5 discusses the MER and management fee findings for mutual funds. The results are organized by the fund characteristics discussed in Appendix A of the report. A general overview is presented for each fund characteristic before we examine changes in MERs and management fees, before and after the full implementation of the CRM2 annual cost and performance reports.
Part 6 discusses the ETF fee findings. The format of the ETF research results mirrors the format for the mutual fund fees findings.
Part 7 summarizes our research findings by research question and CSA staff's view on whether disclosure-based regulations can shift industry behaviour in the desired policy direction.
Appendix A provides details of the study's research design and the formulas for calculating changes in MERs and management fees.
Appendix B explains and provides guidance on how to interpret the fees results for each of the effects we examined.
Appendix C provides supplemental data tables by report sections.
The purpose of this section of the report is to provide a high-level overview of Canadian household discretionary financial wealth and answer the question of whether product manufacturers and distributors are shifting to investment products not captured by the CRM2 annual costs and performance reports. Another intent of this overview is to provide useful information to readers that will assist them in contextualizing the research findings, interpreting, and understanding the research results.
Canadian households held an estimated $4.1 trillion in discretionary financial assets, in 2013.{12} Of this amount, approximately $1.1 trillion were held in investment funds.{13} Another $2.1 trillion were held in securities and deposits ($1.0 billion in securities; $1.1 trillion in deposits).
By the end of 2020, household discretionary financial assets increased to $6.5 trillion and, of this amount, $2.1 trillion were held in investment funds. Equities and deposits each amounted to $1.7 trillion in discretionary financial assets.
Table 3.1 below compares the asset size and share of discretionary financial assets for each investment product type, at the start and end of our study period. The share of assets held in investment funds increased during our study period while the share of assets in securities and deposits remained broadly stable.
At a high-level, an investment fund is an investment product that pools money from various investors and invests that money collectively through a portfolio of financial instruments, such as stocks and/or bonds, and the portfolio of investments is professionally managed by a fund manager.
For the purposes of our research, we collectively refer to mutual funds and ETFs, which are focus of our analysis, and segregated funds as investment funds.{14} Segregated funds are an insurance product and were not covered by the CRM2 annual costs and performance report requirements. We have looked at trends in the segregated fund market because they are often sold by dually registered/licensed advisers who are permitted to sell mutual funds and insurance products such as segregated funds.{15} Their inclusion enables us to assess whether product manufacturers and distributors were engaging in regulatory arbitrage by shifting to products not captured by the CRM2 annual costs and performance requirements.
Table 3.1 Estimated Canadian Discretionary Financial Assets, 2013 and 2020
|
Asset Size ($B) |
Share of discretionary financial assets |
|||
|
|||||
|
2013 |
2020 |
2013 |
2020 |
|
|
|||||
All discretionary financial assets |
4,091 |
6,517 |
- |
- |
|
|
|||||
|
Investment funds |
1,145 |
2,074 |
28% |
32% |
|
|||||
|
Securities |
1,031 |
1,686 |
25% |
26% |
|
|||||
|
Deposits |
1,102 |
1,742 |
27% |
27% |
Source: Investor Economics Household Balance Sheet 2021. Excludes group segregated funds, closed end funds and alternatives
Table 3.2 below compares the amount of financial assets that were in investment funds, and each investment fund type's share of the total investment fund assets and all discretionary financial assets, for 2013 and 2020.{16} Just below one-third (1/3) of all discretionary financial assets were held in investment funds, in both 2013 and 2020.
The most common type of investment fund held was mutual funds, which accounted for 26% of all discretionary financial assets, in 2020. Less widely held investment funds were ETFs and segregated funds. At the end of 2020, 4% of discretionary financial assets were held in ETFs and another 2% were held in segregated funds.
During our study period, the share of assets in ETFs increased by 2 percentage points and the share of assets in mutual funds increased by 4 percentage points. Segregated funds share of total financial assets remained stable (see Table 3.2).
Focusing solely on investment funds, ETFs gained market share during our study period. In 2013, their share of investment funds was 6%. By 2020, ETF market share increased to 12%, thus making it the second most widely held type of investment fund. The market share of mutual funds and segregated funds declined by 4 and 3 percentage points between 2013 and 2020. By the end of our study period, mutual funds accounted for 81% of investment fund assets and segregated funds accounted for another 6%.
Table 3.2 Estimated Canadian Discretionary Financial Assets Held in Investment Funds
|
Assets ($B) |
Share of Investment Funds (%) |
Share of discretionary financial assets (%) |
|||||
|
||||||||
|
2013 |
2020 |
2013 |
2020 |
2013 |
2020 |
||
|
||||||||
All discretionary financial assets |
$4,091 |
$6,517 |
- |
- |
- |
- |
||
|
||||||||
|
Investment funds |
$1,145 |
$2,074 |
- |
- |
28% |
32% |
|
|
||||||||
|
|
Canadian listed ETFs |
$63 |
$257 |
6% |
12% |
2% |
4% |
|
||||||||
|
|
Seg funds |
$101 |
$127 |
9% |
6% |
2% |
2% |
|
||||||||
|
|
Mutual funds excl. ETFs |
$981 |
$1,690 |
86% |
81% |
24% |
26% |
Source: Investor Economics Household Balance Sheet 2021. Excludes group segregated funds, closed end funds and alternatives
The findings presented in this section of the report suggest that product manufacturers and distributors were not shifting to products not subject to the CRM2 requirements.
This section of the report provides a high-level overview of the investment fund industry. The focus is on the number funds and assets by investment fund product types, specifically mutual funds, ETFs and (individual) segregated funds. The intent of this section of the report is to provide key background information that readers may need to understand and interpret the research findings. This section is not intended to provide a detailed overview of the investment fund industry in Canada. Readers interested in this topic can refer to the CSA's Mutual Fund Fees Discussion Paper published in December 2012.{17}
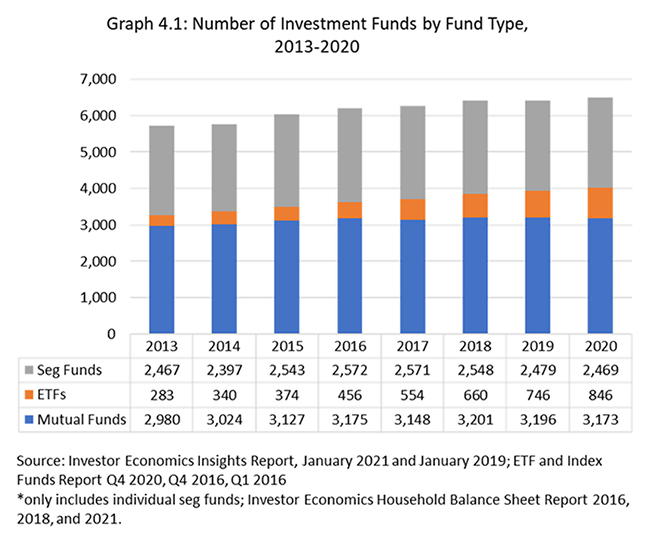
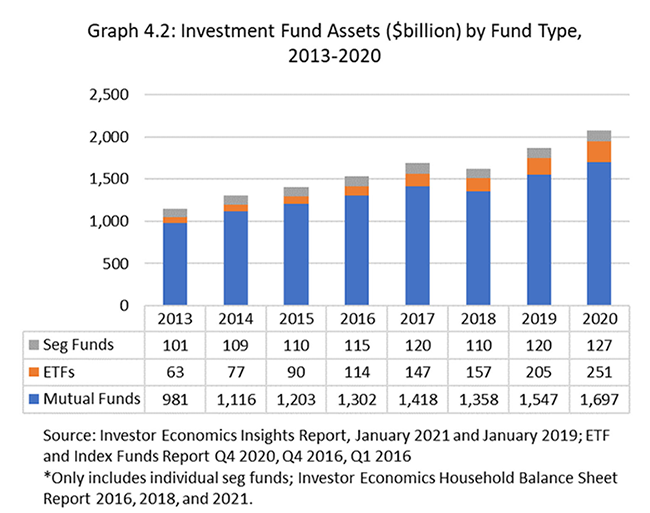
The graphs below show the number of funds and annual assets for each investment fund type.
During our study period, there was a steady rise in the number of ETFs and ETF assets (refer to Graphs 4.1 and 4.2). The average year-over-year increase in the number of ETFs was 17% during our study period. The average year-over-year increase was much lower for mutual funds and segregated funds, and the increases were 1% and 0.05%, respectively.
The number of segregated funds was not proportionate to its share of investment fund assets. Segregated funds accounted for 38% to 43% of investment funds throughout our study period, but only 6% to 9% of investment fund assets. The average annual growth in the number of funds and assets was 0.05% and 3%, respectively.
The number of mutual funds steadily increased during our study period, but they accounted for a declining share of the number of funds and investment fund assets, due to the rising share of ETFs. The average annual growth in the number of mutual funds and their assets were 1% and 8%, respectively.
The orange bars in Graphs 4.1 and 4.2 visualize the growing number of ETFs and their increasing share of investment fund assets, during our study period.
Trends in production creation and distribution were (and continues to be) driven by the need to differentiate product offerings and channels of access to investment funds.
The continued popularity of fund wrap programs has contributed to a rise in the number of fund-of-funds products, for both mutual funds and ETFs, and a corresponding rise in their fund assets (refer to Tables 4.1.1 and 4.1.2). The ratio of the number of stand-alone funds to fund-of-funds products remained constant throughout our study period. The share of assets, however, started to shift away from stand-alone funds to fund-of-fund products, as our study period progressed.{18}
The introduction of ETF-of-ETFs products, i.e., ETFs where the underlying portfolio of securities consists of other ETFs, by one of the larger ETF manufacturers occurred early in 2018.{19} By December 2020, ETF-of-ETF products, accounted for $6 billion or 2% of the total industry ETF assets.{20}
Table 4.1.1 Number of Mutual Funds by Product Type (Industry Total and for Long-Term Funds Only)
Product Type |
2013 |
2014 |
2015 |
2016 |
2017 |
2018 |
2019 |
2020 |
|
||||||||
Stand-alone funds |
1,814 |
1,829 |
1,843 |
1,930 |
1,599 |
2,468 |
2,469 |
2,459 |
|
||||||||
Fund-of-funds |
485 |
495 |
481 |
564 |
501 |
687 |
689 |
678 |
|
||||||||
Total |
2,299 |
2,324 |
2,324 |
2,494 |
2,100 |
3,155 |
3,158 |
3,137 |
|
||||||||
Share of Industry Total |
||||||||
|
||||||||
Stand-alone funds |
79% |
79% |
79% |
77% |
76% |
78% |
78% |
78% |
|
||||||||
Fund-of-funds |
21% |
21% |
21% |
23% |
24% |
22% |
22% |
22% |
Source: IFIC; fund count is for December of each year
Table 4.1.2 Mutual Fund Assets ($B) and Share of Mutual Fund Assets by Product Type (Industry Total and for Long-Term Funds Only){*}
Product Type |
2013 |
2014 |
2015 |
2016 |
2017 |
2018 |
2019 |
2020 |
|
||||||||
Stand-alone funds |
735 |
811 |
839 |
894 |
966 |
908 |
1,040 |
1,130 |
|
||||||||
Fund-of-funds |
264 |
330 |
392 |
445 |
511 |
515 |
591 |
654 |
|
||||||||
Industry Total |
999 |
1,141 |
1,231 |
1,339 |
1,477 |
1,423 |
1,630 |
1,784 |
|
||||||||
Share of Industry Assets |
||||||||
|
||||||||
Stand-alone funds |
74% |
71% |
68% |
67% |
65% |
64% |
64% |
63% |
|
||||||||
Fund-of-funds |
26% |
29% |
32% |
33% |
35% |
36% |
36% |
37% |
Source: IFIC
Another significant trend in the ETF market during our study period was the rise of actively managed and strategic beta ETFs.{21} In March 2014, actively managed and strategic beta ETFs accounted for 23% and 17% of the number of ETFs based on analysis of data from Investor Economics.{22} By December 2020, their respective shares rose to 43% and 21%.{23} The rise in the number of strategic beta ETFs did not lead to a corresponding rise in ETF assets. In contrast, the share of ETF assets in actively managed ETFs increased from 9% at the start of our study period, to 24% by the end of our study period.{24}
A third emerging trend that occurred towards the end of our study period was the rise of and demand for funds with an environmental, social, and governance (ESG) mandate. The number of ESG funds and the assets in these funds steadily increased during our study period, with the greatest year-over-year growth occurring between 2019 and 2020 (refer to Tables 4.1.3 and 4.1.4). By the end of our study period, there were an estimated 97 mutual funds and 50 ETFs with an ESG mandate, and their net assets accounted for 1% of total industry assets within the mutual fund and ETF markets, respectively.{25}
Table 4.1.3 Estimated Number of Funds, and Net Assets of Funds with an ESG Mandate
Fund Type |
2013 |
2014 |
2015 |
2016 |
2017 |
2018 |
2019 |
2020 |
|
|
|||||||||
Number of Funds |
|||||||||
|
|||||||||
|
Mutual Fund |
49 |
46 |
46 |
52 |
61 |
67 |
73 |
97 |
|
|||||||||
|
ETFs |
- |
- |
- |
- |
- |
10 |
20 |
50 |
|
|||||||||
Net Assets ($B) |
|||||||||
|
|||||||||
|
Mutual Fund |
5.1 |
6.0 |
6.8 |
8.0 |
9.8 |
10.1 |
12.3 |
17.6 |
|
|||||||||
|
ETFs |
- |
- |
- |
- |
- |
0.1 |
0.3 |
2.8 |
Source: OSC analysis of IFIC data (sourced from fund prospectuses) . Analysis is limited to long-term mutual funds and ETFs. Fund count and fund assets are as at December of each year.
Table 4.1.4 Estimated Year-over-Year Change in the Number of Funds, and Net Assets of Funds with an ESG Mandate
Fund Type |
13-'14 |
14-'15 |
'15-'16 |
'16-'17 |
'17-'18 |
'18-'19 |
'19-'20{*} |
|
|
||||||||
Number of Funds |
||||||||
|
||||||||
|
Mutual Fund |
-6% |
0% |
13% |
17% |
10% |
9% |
33% |
|
||||||||
|
ETFs |
- |
- |
- |
- |
- |
100% |
150% |
|
||||||||
Net Assets ($B) |
||||||||
|
||||||||
|
Mutual Fund |
17% |
13% |
18% |
23% |
3% |
22% |
43% |
|
||||||||
|
ETFs |
|
|
|
|
|
162% |
954% |
Source: OSC analysis of IFIC data (sourced from fund prospectuses) . Analysis is limited to long-term mutual funds and ETFs.
A new direct to investor/consumer distribution channel emerged in 2014 with the launch of four online advice platforms -- Wealthsimple, Wealth Bar{26}, NestWealth, and Questwealth Portfolios. As noted in CSA Staff Notice 31-342.{27}
Unlike "robo-advisors" in the USA, these online advice platforms "offer hybrid services that utilize an online platform for efficiency, while registered advising representatives (ARs) remain actively involved. These platforms use online questionnaires as the basis for the know-your-client (KYC) information gathering process, but ARs are responsible for determining that sufficient KYC information has been gathered to support investment suitability determinations. Clients' managed accounts are invested in relatively simple products, including unleveraged exchange traded funds (ETFs), low cost mutual funds or other redeemable investment funds, cash and cash equivalents. Often, model portfolios are created using algorithmic software although, again, an AR has responsibility for the suitability of each client's investment."
By the end of 2020, 22 online advisers{28} operated in Canada. These firms had an estimated $10 billion in AUM.{29}
Another notable trend that emerged during our study period was the shift away from commission-based to fee-based products and/accounts. This was most pronounced in mutual funds, and the growth of fee-based "F-series".{30} In 2013, the number of funds with a F-series accounted for 23% of all mutual funds, and by 2020, this figure rose to 29% (refer to Graph 4.3). The number of F-series surpassed the number of A-series starting in 2017.{31} We hypothesize and have heard anecdotally that the proposed regulations related to embedded commissions in mutual funds and the Client Focused Reforms were important drivers behind this change, as IFMs started creating F-series, in response to a shift in adviser practice models.
The shift in assets can be seen in our study sample. In 2013, 5% of assets were in F-series and, by 2020, this figure had increased to 27%. For the same time periods, the share of total fund assets in A-series decreased from 82% to 58% (refer to Graph 4.4).
Our analysis of mutual fund MERs and management fees consisted of 2,990 unique mutual funds, at the fund level, and 13,617 series. The total AUM of these funds was $781 billion in 2020, and these funds accounted for 44% of the total industry AUM of $1.78 trillion.{32} Table 5.1.1 breaks down the number of funds and their assets, returns, and fees for each year of our study period.
Fund assets steadily increased during our study period, from $545 billion in 2013 to $781 billion in 2020. Our study sample accounted for about 50% of total industry assets, on average.{33}
There were no clear overall directional trends in mutual fund returns during our study period. The asset-weighted annualized gross returns were positive for all but one year -- 2018 -- and returns ranged from -3.84% to 13.28%. While not a focus of our study, the fees and returns findings indicate that investors holding mutual funds, on average, realized positive net returns in 7 of the 8 years of our study period.
The simple average and asset-weighted average MERs and management fees steadily decreased for each year of our study period.
From 2013 to 2019 the simple average MER was lower than the asset-weighted average MER, and this relationship only reversed in 2020. This finding indicates that for seven years of our study, assets were concentrated in series with higher MERs and the asset shift to series with comparatively lower MERs only became evident in the final year of our study period.
Table 5.1.1 Mutual Fund Assets, Returns, and Fees, 2013-2020
|
2013 |
2014 |
2015 |
2016 |
2017 |
2018 |
2019 |
2020 |
|
||||||||
Net assets ($B) of series in study |
545 |
622 |
632 |
671 |
708 |
699 |
747 |
781 |
|
||||||||
Industry assets ($B) |
999 |
1,141 |
1,231 |
1,339 |
1,477 |
1,423 |
1,630 |
1,784 |
|
||||||||
Share of industry assets (series in study) |
55% |
54% |
51% |
50% |
48% |
49% |
46% |
44% |
|
||||||||
Number of funds in study (at the fund level) |
2,235 |
2,344 |
2,379 |
2,480 |
2,442 |
2,421 |
2,348 |
2,254 |
|
||||||||
Number of series in study |
7,497 |
8,382 |
9,120 |
10,175 |
10,549 |
11,067 |
10,539 |
10,011 |
|
||||||||
Number of series -- industry total |
8,652 |
9,356 |
15,175 |
18,813 |
20,644 |
21,232 |
21,784 |
22,066 |
|
||||||||
Share of industry total -- number of series in study |
87% |
90% |
60% |
54% |
51% |
52% |
48% |
45% |
|
||||||||
Asset-weighted annualized gross returns (%) |
13.05 |
8.21 |
3.08 |
7.26 |
7.22 |
-3.84 |
13.28 |
9.45 |
|
||||||||
Simple average MER |
1.96 |
1.93 |
1.88 |
1.82 |
1.77 |
1.71 |
1.69 |
1.69 |
|
||||||||
Asset-weighted average MER |
2.06 |
2.03 |
1.98 |
1.93 |
1.83 |
1.77 |
1.70 |
1.67 |
|
||||||||
Simple management fee |
1.49 |
1.47 |
1.44 |
1.40 |
1.36 |
1.33 |
1.32 |
1.31 |
|
||||||||
Asset-weighted average management fee |
1.65 |
1.64 |
1.61 |
1.56 |
1.48 |
1.43 |
1.38 |
1.36 |
CSA analysis of data obtained from investment fund managers and third-party data providers. Assets and expense data were obtained from Investor Economics. Gross monthly total returns data were obtained from Morningstar Direct. Assets are as at December. Funds in our study sample exclude institutional fund series.
This section of the report presents the research findings for all mutual funds, i.e., without grouping the mutual funds into different fund characteristics, for the pre- and post-implementation periods.
The asset-weighted average MER and management fee declined during both the pre- and post-implementation periods (refer to Tables 5.1.1 and 5.2.1). In 2013, the asset-weighted average MER was 206 basis points and by 2016 it had declined by 13 basis points (or 6%), to 193 basis points. In 2017, the asset-weighted average MER was 183 basis points, and by 2020 it had declined to 167 basis points, which was a 16 basis point (or 9%) decline. This trend was seen in the aggregate and, on average, at the individual fund level.
The asset-weighted average management fee declines were smaller than the MER declines. The pre-implementation decline was 9 basis points (5%), and the post-implementation decline was 13 basis points (8%). This finding was expected since, in general, the management fee accounts for most of an MER.
The negative fund asset-weight effects, for both the asset-weighted average MER and management fee, were larger than the negative price effects during the pre-implementation period (refer to the Fund Weight (FW) Effect and Price Effect rows in Table 5.2.1). This finding tells us two things. First, both the fund asset-weight and price effects contributed to lowering the asset-weighted fees.{34} Second, the fund asset-weight effect, i.e., changes in the distribution of assets across the different the series in our sample, however had a greater impact than the price effect in driving down the asset-weighted fees during the pre-implementation period. The relative impact between the fund asset weight and price effects in decreasing the asset-weighted average fees was broadly similar during the post-implementation period.
Table 5.2.1 Changes in AW Avg MERs/Mgmt Fees, All Mutual Funds, Pre- and Post-Implementation Periods
|
AW Avg MERs |
AW Avg Mgmt Fees |
||||
|
||||||
|
Chg '13-'16 |
Chg '17-'20 |
Chg '13-'16 |
Chg '17-'20 |
||
|
||||||
AW Avg MER Chg/Mgmt Fee Chg |
-0.13 |
-0.16 |
-0.09 |
-0.13 |
||
|
||||||
Fund Weight (FW) Effect |
-0.09 |
-0.12 |
-0.07 |
-0.10 |
||
|
||||||
|
of which... |
|
|
|
|
|
|
||||||
|
|
Sales Effect |
-0.11 |
-0.12 |
-0.08 |
-0.10 |
|
||||||
|
|
Returns Effect |
0.02 |
0.00 |
0.01 |
0.00 |
|
||||||
Price Effect |
-0.02 |
-0.01 |
-0.01 |
-0.01 |
||
|
||||||
FW + Price Effects |
-0.02 |
-0.02 |
-0.01 |
-0.01 |
||
|
||||||
Share of series with fund weight declines |
42% |
61% |
42% |
61% |
||
|
||||||
Share of series with price declines |
58% |
54% |
17% |
11% |
||
Fund Weight and Price Effects, and shares of series with fund weight and price declines, are calculated using series where both expense and asset data are available over the specific implementation period. CSA analysis of data obtained from investment fund managers and third-party data providers. Assets and expense data were directly obtained from Investor Economics. Returns data were obtained from Morningstar Direct.
The interaction effect (refer to the FW+Price Effects row in Table 5.2.1 also contributed to decreasing the asset-weighted fees. The size of the interaction effect ranged from 1 to 2 basis points.
An explanation and interpretation of these effects are provided below, using a subset of the research findings.
We caution readers that the size of the asset-weighted average MER/management fee changes discussed in this section of the report are not equal to the sum of the different fee changes by fund characteristic discussed in the proceeding sections of the report. This is because the asset-weighted averages reported above are calculated using all series in our sample, whereas the averages by fund characteristic discussed below are based on only the subset of series captured by each fund characteristic. |
As noted above, the asset-weighted average MER decreased by 13 and 16 basis points respectively during the pre- and post-implementation periods, and part of the decrease was driven by series with declines in their share of total assets covered by our sample. Specifically, 42% of series during the pre-implementation period and 61% of series during the post-implementation period experienced a decline in their assets and in turn their asset weights.{35} These declines would have lowered the aggregate asset-weighted average MERs by 9 and 12 basis points for the respective time periods if funds kept their fees constant over each period (refer to Table 5.2.1).
The findings pertaining to the share of series with declines in their assets and the size of the fund asset weight effect indicate that the relationship between these two variables is not linear; that is, a large numerical value for one variable does not correlate to a large numerical value for the other. Rather, the primary factor that dictates the size of the fund asset weight effect is the aggregate assets of the series with declines in their share of total assets covered by the sample, while the number of series is a secondary factor. A conclusion that can then be drawn from the MER findings is that larger funds contributed to the negative fund asset weight effect, particularly during the pre-implementation period.
Within the fund asset weight effect, we see that changes in assets arising from sales, in the aggregate, contributed to lowering the asset-weighted average MER and management fee, in both the pre- and post-implementation periods. A negative value for the sales effect does not indicate that in the aggregate there was negative sales for the series in our study sample. Rather, a negative value indicates that a sufficient number of series saw large enough declines in their asset shares due to sales, such that the asset share changes contributed to lowering the overall asset-weighted average MER/management fee.
Conversely, a positive return effect tells us that a sufficient number of series saw their asset shares increase because of asset growth arising from investment returns, such that the asset share changes contributed to increasing the aggregated asset-weighted average MER/management fee.
The purpose of the fund asset weight effect is to understand how changes in distribution of assets across series are contributing to changes in the asset-weighted average fee, while holding MERs/management fees constant. This metric is therefore not suitable for making inferences about whether assets were flowing into funds with lower or higher fees, overall. More appropriate metrics to use are the asset-weighted average MER and management fee findings, in Table 5.1.1, because these metrics consider changes in both a series' assets and MER/management fee rate. The conclusion that can be drawn from the findings in Table 5.1.1 is that assets generally flowed into funds with lower MER/management fee rates, and that MERs and management fees, on average, decreased.
The negative price effects indicate the following necessary and sufficient changes took place for series that operated over the entire given time periods:
i) a sufficient number of series lowered their MER or management fee rates
ii) the size of the fee reductions for these series was sufficiently large, and
iii) these series had sufficiently large assets
such that these three conditions contributed to lowering the aggregated asset-weighted average MER/management fee, for both the pre- and post- implementation periods by the amounts shown in Table 5.2.1.
The relationship between the share of series with declines in their fees and the price effect is not linear. A higher (lower) share of series with declines in their fees does not necessarily equate to a larger (smaller) price effect. The size of the price effect is determined by the interplay between the size of the fee reductions and whether these reductions occurred in series with relatively higher or lower fund asset weights.
Additionally, comparing the share of series with price declines and the corresponding price effect between fee types (and fund characteristics in proceeding sections of the report) or time periods is not meaningful due to differences in the sample size and population of series.{36} The only meaningful comparison that can be made for the price effect, across fee type, fund characteristics, and time periods is the size of the price effect and its contribution to the directional change in the aggregated asset-weighted average MER/management fees for the particular fee type, characteristic or time period. The price effect can also be compared to the fund asset weight effect for the same comparative analysis.
The interaction effect is more difficult to interpret than the individual price or fund asset weight effects because it is measuring the impacts of two variable changes at once rather than a single variable change, which is the procedure used to measure the fund asset weight and price effects.
The interaction effect can increase, decrease, or have no impact on the aggregated asset-weighted average MER/management fee. The size and direction of the interaction effect varied depending on the fund characteristics looked at in our study.
Two scenarios were responsible for the interaction effects observed in our study, as illustrated in Figure 1 in Appendix B of the report. The first scenario was due to the addition of new series or the deletion of existing series.{37} In general, the addition of new series occurred more often in our sample during the pre-implementation period than the post-implementation period. The second scenario was instances where series had simultaneous changes in their asset weights and MER or management fee rates.{38}
The distribution and number of mutual fund assets by broad asset class are shown below in Table 5.3.1. The dominant broad asset classes of funds throughout our study period were balanced funds, with 55% of mutual fund assets in our sample in 2020.{40} The other two dominant broad asset classes of funds were equity and fixed income funds. These funds accounted for 32% and 11% of total fund assets in our sample in 2020. Funds in the money market and other broad asset class categories accounted for the remaining 1% of assets in the final year of our study period. Balanced, equity, and fixed income funds' share of the total assets in our sample remained relatively constant throughout our study period.
Table 5.3.1 Mutual Fund Assets ($B) by Broad Asset Class
Broad Asset Class |
2013 |
2014 |
2015 |
2016 |
2017 |
2018 |
2019 |
2020 |
No. of Series in Sample |
|
|||||||||
Balanced |
278 |
335 |
350 |
375 |
392 |
386 |
420 |
431 |
4,655 |
|
|||||||||
Equity |
200 |
220 |
214 |
224 |
237 |
234 |
238 |
252 |
6,890 |
|
|||||||||
Fixed Income |
59 |
59 |
61 |
65 |
71 |
70 |
81 |
89 |
1,692 |
|
|||||||||
Money Market |
6 |
5 |
5 |
4 |
4 |
4 |
5 |
5 |
110 |
|
|||||||||
Other |
2 |
3 |
3 |
3 |
4 |
4 |
4 |
3 |
270 |
|
|||||||||
Total |
545 |
622 |
632 |
671 |
708 |
699 |
747 |
781 |
13,617 |
CSA analysis of data obtained from investment fund managers and third-party data providers. Asset data were directly obtained from Investor Economics. Broad asset class data developed by the CSA using CIFSC data provided by investment fund managers. The "Other" broad asset class category represents funds that investment in so called alternative/non-traditional assets such as real estate or derivatives products.
The asset-weighted fees for funds of all three dominant broad asset classes steadily declined during our study period (refer to Tables 5.3.2 and 5.3.3).{41} The size of the decline was greater for the asset-weighted average MER than the asset-weighted average management fee. The size of the fee declines varied by asset classes, and it ranged from 32 to 48 basis points (15% to 30%) over 2013-2020 for the asset-weighted average MERs, and 24 to 38 basis points (14% to 32%) for the asset-weighted average management fees.
The asset-weighted average MERs and management fees for equity funds were, on average, slightly greater than the fees for balanced funds throughout our study period. Balanced and equity funds had asset-weighted average MERs that were above 200 basis points at the start of our study period, in 2013. The asset-weighted average MERs dropped below 180 basis points by the end of our study period, in 2020. Fixed income funds had the lowest asset-weighted average MERs and management fees of the three dominant asset classes. The cost difference between fixed income funds and equity/balanced funds was 64-78 basis points, for the asset-weighted average MER, and 49-63 basis points, for the asset-weighted average management fee, depending on the year of our study period.
Table 5.3.2 Asset-Weighted Average MERs by Broad Asset Class, 2013 to 2020
Broad Asset Class |
2013 |
2014 |
2015 |
2016 |
2017 |
2018 |
2019 |
2020 |
Chg '13-'16 |
Chg '17-'20 |
|
||||||||||
Balanced |
2.10 |
2.07 |
2.03 |
1.98 |
1.90 |
1.85 |
1.79 |
1.78 |
-0.12 |
-0.12 |
|
||||||||||
Equity |
2.22 |
2.17 |
2.12 |
2.05 |
1.94 |
1.87 |
1.77 |
1.74 |
-0.17 |
-0.19 |
|
||||||||||
Fixed Income |
1.46 |
1.40 |
1.35 |
1.28 |
1.19 |
1.13 |
1.06 |
1.02 |
-0.18 |
-0.17 |
CSA analysis of data obtained from investment fund managers and third-party data providers. Asset and expense data were directly obtained from Investor Economics.
Table 5.3.3 Asset-Weighted Average Management Fees by Broad Asset Class, 2013 to 2020
Broad Asset Class |
2013 |
2014 |
2015 |
2016 |
2017 |
2018 |
2019 |
2020 |
Chg '13-'16 |
Chg '17-'20 |
|
||||||||||
Balanced |
1.69 |
1.69 |
1.65 |
1.62 |
1.55 |
1.50 |
1.47 |
1.45 |
-0.08 |
-0.10 |
|
||||||||||
Equity |
1.75 |
1.73 |
1.70 |
1.63 |
1.55 |
1.49 |
1.44 |
1.41 |
-0.12 |
-0.14 |
|
||||||||||
Fixed Income |
1.20 |
1.16 |
1.11 |
1.04 |
0.97 |
0.91 |
0.85 |
0.82 |
-0.16 |
-0.15 |
CSA analysis of data obtained from investment fund managers and third party data providers. Asset and expense data were directly obtained from Investor Economics.
Declines in the asset-weighted average MERs and management fees were seen for funds of all three dominant broad asset classes, in both the pre- and post-implementation periods (refer to Tables 5.3.4 and 5.3.5). The asset-weighted average MER/management fee declines ranged from 8 to 18 basis points (or 5% to 13%) during the pre-implementation period, and 10 to 19 basis points during the post-implementation period (or 6% to 15%).
During both periods, changes in the distribution of assets across series played a larger role than reductions in MER/management fee rates in driving down the asset-weighted average MERs/management fees. Changes in the distribution of assets across series arising from sales contributed to lowering the asset-weighted average MERs/management fees. Conversely, changes in the distribution of assets attributable to investment returns had little impact on the asset-weighted average MERs/management fees.
The interaction effect for balanced series was close to zero in both the pre-and post-implementation periods. For equity and fixed income series, the interaction effect was negative. This was mainly attributable to the addition and termination of series over the period.
Table 5.3.4 Changes in the Asset-Weighted (AW) Average MERs by Select Broad Asset Classes
|
Balanced |
Equity |
Fixed Income |
|||||
|
||||||||
|
Chg '13-'16 |
Chg '17-'20 |
Chg '13-'16 |
Chg '17-'20 |
Chg '13-'16 |
Chg '17-'20 |
||
|
||||||||
AW Avg MER Chg |
-0.12 |
-0.12 |
-0.17 |
-0.19 |
-0.18 |
-0.17 |
||
|
||||||||
Fund Weight (FW) Effect |
-0.09 |
-0.11 |
-0.11 |
-0.14 |
-0.11 |
-0.08 |
||
|
||||||||
|
of which... |
|
|
|
|
|
|
|
|
||||||||
|
|
Sales Effect |
-0.09 |
-0.11 |
-0.11 |
-0.13 |
-0.11 |
-0.07 |
|
||||||||
|
|
Returns Effect |
0.00 |
-0.01 |
0.00 |
-0.01 |
0.00 |
-0.01 |
|
||||||||
Price Effect |
-0.02 |
-0.01 |
-0.03 |
-0.02 |
-0.02 |
-0.04 |
||
|
||||||||
FW + Price Effects |
-0.01 |
0.00 |
-0.03 |
-0.02 |
-0.04 |
-0.06 |
||
|
||||||||
Share of series with fund weight declines |
41% |
59% |
39% |
61% |
49% |
64% |
||
|
||||||||
Share of series with price declines |
53% |
50% |
63% |
56% |
55% |
58% |
||
Fund Weight and Price Effects, and shares of series with fund weight and price declines, are calculated using series where both expense and asset data are available over the specific implementation period. CSA analysis of data obtained from investment fund managers and third party data providers. Asset and expense data were obtained from Investor Economics. Returns data were obtained from Morningstar Direct.
Table 5.3.5 Changes in the Asset-Weighted (AW) Average Management Fees by Select Broad Asset Classes
|
Balanced |
Equity |
Fixed Income |
|||||
|
||||||||
|
Chg '13-'16 |
Chg '17-'20 |
Chg '13-'16 |
Chg '17-'20 |
Chg '13-'16 |
Chg '17-'20 |
||
|
||||||||
AW Avg Mgmt Fee Chg |
-0.08 |
-0.10 |
-0.12 |
-0.14 |
-0.16 |
-0.15 |
||
|
||||||||
Fund Weight (FW) Effect |
-0.07 |
-0.10 |
-0.09 |
-0.12 |
-0.10 |
-0.06 |
||
|
||||||||
|
of which... |
|
|
|
|
|
|
|
|
||||||||
|
|
Sales Effect |
-0.07 |
-0.09 |
-0.08 |
-0.11 |
-0.10 |
-0.06 |
|
||||||||
|
|
Returns Effect |
0.01 |
0.00 |
0.00 |
-0.01 |
0.00 |
-0.01 |
|
||||||||
Price Effect |
-0.01 |
0.00 |
-0.01 |
-0.01 |
-0.03 |
-0.03 |
||
|
||||||||
FW + Price Effects |
0.00 |
0.00 |
-0.02 |
-0.01 |
-0.03 |
-0.05 |
||
|
||||||||
Share of series with fund weight declines |
41% |
59% |
39% |
61% |
49% |
64% |
||
|
||||||||
Share of series with price declines |
18% |
10% |
17% |
9% |
21% |
20% |
||
Fund Weight and Price Effects, and shares of series with fund weight and price declines, are calculated using series where both expense and asset data are available over the specific implementation period. CSA analysis of data obtained from investment fund managers and third-party data providers. Asset and expense data were directly obtained from Investor Economics. Investor Economics. Returns data obtained from Morningstar Direct.
The distribution of mutual fund assets by series type is shown below in Table 5.4.1. Each fund has multiple series/classes and the dominant series/class types in our study sample were "Series A" and "Series F" (herein after A-series and F-series). A-series are the original/core series that have traditionally populated the mutual fund market, and they include an embedded trailing commission. F-series were developed for fee-based accounts, and they do not include an embedded trailing commission.{43} A-series and F-series accounted for 82% and 5%, respectively, of our study sample assets at the start of our study period. As our study period progressed, assets in F-series grew while assets in A-series declined. By the end of our study period, F-series accounted for 27% of assets and A-series accounted for 58% of assets in our study sample.
Table 5.4.1 Mutual Funds Assets ($B) by Series Type
Series Type |
2013 |
2014 |
2015 |
2016 |
2017 |
2018 |
2019 |
2020 |
No. of Series |
|
|||||||||
A |
446 |
488 |
470 |
476 |
470 |
437 |
449 |
455 |
3,477 |
|
|||||||||
ADV |
28 |
30 |
30 |
29 |
28 |
26 |
26 |
22 |
603 |
|
|||||||||
D |
10 |
11 |
11 |
12 |
13 |
13 |
15 |
16 |
536 |
|
|||||||||
F |
26 |
40 |
54 |
78 |
114 |
142 |
179 |
208 |
4,695 |
|
|||||||||
O |
24 |
41 |
55 |
64 |
71 |
71 |
68 |
69 |
2,638 |
|
|||||||||
T |
11 |
12 |
12 |
12 |
11 |
11 |
10 |
9 |
1,668 |
|
|||||||||
Total |
545 |
622 |
632 |
671 |
708 |
699 |
747 |
781 |
13,617 |
CSA analysis of data obtained from investment fund managers and third-party data providers. Asset and expense data were obtained from Investor Economics.
A-series had a higher asset-weighted average MER/management fee than F-series throughout our study period, and the average difference was 110 basis points for the MER and 93 basis points for the management fee (refer to Table 5.4.2).{44} This finding was expected as A-series include an embedded trailing commission while F-series do not.
The asset-weighted average MER and management fee incrementally declined for both series types during our study period. By the end of our study period the asset-weighted average MER for A-series remained above 200 basis points while it fell below 100 basis points for F-series.
Table 5.4.2 Asset-Weighted Average MERs by Series Type, 2013-2020
Series Type |
2013 |
2014 |
2015 |
2016 |
2017 |
2018 |
2019 |
2020 |
Chg '13-'16 |
Chg '17-'20 |
|
||||||||||
A |
2.15 |
2.14 |
2.12 |
2.10 |
2.06 |
2.06 |
2.01 |
2.02 |
-0.05 |
-0.04 |
|
||||||||||
F |
1.09 |
1.07 |
1.03 |
1.00 |
0.95 |
0.92 |
0.91 |
0.91 |
-0.10 |
-0.04 |
CSA analysis of data obtained from investment fund managers and third-party data providers. Asset and expense data were directly obtained from Investor Economics.
Table 5.4.3 Asset-Weighted Average Management Fees by Series Type, 2013-2020
Series Type |
2013 |
2014 |
2015 |
2016 |
2017 |
2018 |
2019 |
2020 |
Chg '13-'16 |
Chg '17-'20 |
|
||||||||||
A |
1.72 |
1.73 |
1.72 |
1.71 |
1.68 |
1.67 |
1.65 |
1.66 |
-0.01 |
-0.03 |
|
||||||||||
F |
0.82 |
0.82 |
0.79 |
0.77 |
0.73 |
0.72 |
0.72 |
0.72 |
-0.05 |
-0.01 |
CSA analysis of data obtained from investment fund managers and third-party data providers. Asset data were obtained from Investor Economics.
The asset-weighted average MER and management fee declined for both A-series and F-series during our study period. The declines ranged from 1 to 10 basis points (or 1% to 9%) for the pre-implementation period, and 1 to 4 basis points (or 2% to 4%) for the post-implementation period. The pre-implementation decline was somewhat greater for F-series than A-series, and this relationship was reversed for the post-implementation period (refer to Tables 5.4.4 and 5.4.5).
For A-series, both the price effect and the fund asset weight effect contributed to lowering the asset-weighted average MER/management fee for both the pre- and post-implementation periods. For F-series, declines in MER/management fee rates rather than shifts in assets towards series with lower fees had a slightly larger effect in lowering the asset-weighted average MER/management fee, particularly during post-implementation period.
The interaction effect was generally small for both series during both periods. The negative effect for F-series in the post-implementation period was primarily attributable to the addition and termination of series.
Table 5.4.4 Changes in the Asset-Weighted (AW) Average MERs by Select Series Type
|
Series A |
Series F |
||||
|
||||||
|
Chg '13-'16 |
Chg '17-'20 |
Chg '13-'16 |
Chg '17-'20 |
||
|
||||||
AW Avg MER Chg |
-0.05 |
-0.04 |
-0.10 |
-0.04 |
||
|
||||||
Fund Weight (FW) Effect |
-0.02 |
-0.02 |
-0.04 |
0.01 |
||
|
||||||
|
of which... |
|
|
|
|
|
|
||||||
|
|
Sales Effect |
-0.04 |
-0.03 |
-0.06 |
0.01 |
|
||||||
|
|
Returns Effect |
0.02 |
0.00 |
0.02 |
0.01 |
|
||||||
Price Effect |
-0.02 |
-0.01 |
-0.05 |
-0.02 |
||
|
||||||
FW + Price Effects |
-0.01 |
-0.01 |
0.00 |
-0.03 |
||
|
||||||
Share of series with fund weight declines |
54% |
62% |
54% |
66% |
||
|
||||||
Share of series with price declines |
54% |
52% |
62% |
59% |
||
Fund Weight and Price Effects, and shares of series with fund weight and price declines, are calculated using series where both expense and asset data are available over the specific implementation period. CSA analysis of data obtained from investment fund managers and third party data providers. Asset and expense data were obtained from Investor Economics. Returns data obtained from Morningstar Direct.
Table 5.4.5 Changes in the Asset-Weighted (AW) Average Management Fees by Select Series Type
|
Series A |
Series F |
||||
|
||||||
|
Chg '13-'16 |
Chg '17-'20 |
Chg '13-'16 |
Chg '17-'20 |
||
|
||||||
AW Avg Mgmt Fee Chg |
-0.01 |
-0.03 |
-0.05 |
-0.01 |
||
|
||||||
Fund Weight (FW) Effect |
0.00 |
-0.02 |
-0.03 |
0.02 |
||
|
||||||
|
of which... |
|
|
|
|
|
|
||||||
|
|
Sales Effect |
-0.02 |
-0.02 |
-0.04 |
0.01 |
|
||||||
|
|
Returns Effect |
0.01 |
0.00 |
0.01 |
0.01 |
|
||||||
Price Effect |
-0.01 |
-0.01 |
-0.03 |
-0.01 |
||
|
||||||
FW + Price Effects |
0.00 |
0.00 |
0.01 |
-0.02 |
||
|
||||||
Share of series with fund weight declines |
54% |
62% |
54% |
66% |
||
|
||||||
Share of series with price declines |
13% |
13% |
16% |
14% |
||
Fund Weight and Price Effects, and shares of series with fund weight and price declines, are calculated using series where both expense and asset data are available over the specific implementation period. CSA analysis of data obtained from investment fund managers and third-party data providers. Asset and expense data were directly obtained from Investor Economics. Returns data obtained from Morningstar Direct.
There are four mutual fund product types in our analysis -- stand-alone funds and three types of fund-of-funds (FoF). The three types of FoF are: 3rd party FoF, proprietary & 3rd party FoF, and proprietary FoF.{45} Of the four product types, stand-alone funds and proprietary FoF accounted for 61% and 29% of total mutual fund assets, in 2020 ($477B in stand-alone funds, $229B in proprietary FoF -- refer to Table 5.5.1 below).
During our study period, the share of assets in stand-alone funds declined while the share of assets in proprietary FoF increased. In 2013, stand-alone funds accounted for 73% of total fund assets in our study sample. By 2020, this figure fell to 61%. Conversely, proprietary FoF accounted for 19% and 29% of total fund assets in 2013 and 2020, respectively.
The share of assets in the other two product types remained relatively unchanged during our study period.
Table 5.5.1 Mutual Fund Assets ($B) by Product Type
Product Type |
2013 |
2014 |
2015 |
2016 |
2017 |
2018 |
2019 |
2020 |
No. of Series |
|
|||||||||
3rd Party Fund-of-Funds |
8 |
10 |
11 |
12 |
12 |
12 |
12 |
13 |
196 |
|
|||||||||
Proprietary & 3rd Party Fund-of-Funds |
31 |
38 |
44 |
47 |
52 |
56 |
60 |
60 |
720 |
|
|||||||||
Proprietary Fund-of-Funds |
106 |
131 |
147 |
165 |
177 |
182 |
207 |
229 |
2,538 |
|
|||||||||
Stand-Alone Mutual Funds |
400 |
441 |
430 |
447 |
466 |
448 |
467 |
477 |
10,163 |
|
|||||||||
Total |
545 |
622 |
632 |
671 |
708 |
699 |
747 |
781 |
13,617 |
CSA analysis of data obtained from investment fund managers and third-party data providers. Asset data were obtained from Investor Economics and data on a fund's product type from investment fund managers.
The next two tables present the asset-weighted average MERs and management fees for the two dominant product types for each year of our study, and for the pre- and post-implementation periods. The asset-weighted average MERs/management fees for the other product types can be found in Appendix C.
Table 5.5.2 Asset-Weighted Average MERs by Product Type
Product Type |
2013 |
2014 |
2015 |
2016 |
2017 |
2018 |
2019 |
2020 |
Chg '13-'16 |
Chg '17-'20 |
|
||||||||||
Proprietary Fund-of-Funds |
2.11 |
2.08 |
2.04 |
2.00 |
1.91 |
1.84 |
1.77 |
1.74 |
-0.12 |
-0.17 |
|
||||||||||
Stand-Alone Mutual Funds |
2.03 |
2.00 |
1.94 |
1.88 |
1.78 |
1.71 |
1.62 |
1.60 |
-0.15 |
-0.18 |
CSA analysis of data obtained from investment fund managers and third-party data providers. Asset and expense data were obtained from Investor Economics.
Table 5.5.3 Asset-Weighted Average Management Fees by Product Type
Product Type |
2013 |
2014 |
2015 |
2016 |
2017 |
2018 |
2019 |
2020 |
Chg '13-'16 |
Chg '17-'20 |
|
||||||||||
Proprietary Fund-of-Funds |
1.73 |
1.71 |
1.68 |
1.63 |
1.57 |
1.51 |
1.46 |
1.42 |
-0.10 |
-0.15 |
|
||||||||||
Stand-Alone Mutual Funds |
1.61 |
1.60 |
1.56 |
1.50 |
1.43 |
1.37 |
1.32 |
1.30 |
-0.10 |
-0.13 |
CSA analysis of data obtained from investment fund managers and third-party data providers. Asset and expense data were obtained from Investor Economics.
The asset-weighted average MERs/management fees incrementally declined for both product types during our study period (refer to Tables 5.5.2 and 5.5.3). Proprietary FoF had higher asset-weighted average fees than stand-alone funds, and the difference was an average of 12 basis points for the MER and 13 basis points for the management fee. The asset-weighted average MERs for both product types were above 200 basis points at the start of our study and fell below 200 basis points by the end of our study period.
Similar sized declines were seen in the asset-weighted average MERs and management fees, for both product types, during the pre- and post-implementation periods (refer to Tables 5.5.4 and 5.5.5). The declines ranged from 10 to 15 basis points (or 6% to 7%) for the pre-implementation period, and 13 to 18 basis points (or 9% to 10%) for the post-implementation period.
The fund asset weight effect had a larger impact than the price effect in lowering the asset-weighted average MERs and management fees, for both time periods.
The negative interaction effects were primarily driven by the introduction and termination of series over implementation periods.
Table 5.5.4 Changes in the Asset-Weighted (AW) Average MERs by Select Product Type
|
Proprietary Fund-of-Funds |
Stand-Alone Mutual Funds |
||||
|
||||||
|
Chg '13-'16 |
Chg '17-'20 |
Chg '13-'16 |
Chg '17-'20 |
||
|
||||||
AW Avg MER Chg |
-0.12 |
-0.17 |
-0.15 |
-0.18 |
||
|
||||||
Fund Weight (FW) Effect |
-0.09 |
-0.12 |
-0.10 |
-0.14 |
||
|
||||||
|
of which... |
|
|
|
|
|
|
||||||
|
|
Sales Effect |
-0.10 |
-0.12 |
-0.12 |
-0.14 |
|
||||||
|
|
Returns Effect |
0.01 |
0.00 |
0.02 |
0.00 |
|
||||||
Price Effect |
-0.01 |
0.00 |
-0.03 |
-0.02 |
||
|
||||||
FW + Price Effects |
-0.02 |
-0.04 |
-0.02 |
-0.02 |
||
|
||||||
Share of series with fund weigh declines |
47% |
59% |
40% |
61% |
||
|
||||||
Share of series with price declines |
51% |
50% |
61% |
56% |
||
Fund Weight and Price Effects, and shares of series with fund weight and price declines, are calculated using series where both expense and asset data are available over the specific implementation period. CSA analysis of data obtained from investment fund managers and third-party data providers. Asset and expense data were directly obtained from Investor Economics. Returns data obtained from Morningstar Direct.
Table 5.5.5 Changes in the Asset-Weighted (AW) Average Management Fees by Select Product Type
|
Proprietary Fund-of-Funds |
Stand-Alone Mutual Funds |
||||
|
||||||
|
Chg '13-'16 |
Chg '17-'20 |
Chg '13-'16 |
Chg '17-'20 |
||
|
||||||
AW Avg Mgmt Fee Chg |
-0.10 |
-0.15 |
-0.10 |
-0.13 |
||
|
||||||
Fund Weight (FW) Effect |
-0.08 |
-0.11 |
-0.08 |
-0.11 |
||
|
||||||
|
of which... |
|
|
|
|
|
|
||||||
|
|
Sales Effect |
-0.09 |
-0.11 |
-0.10 |
-0.11 |
|
||||||
|
|
Returns Effect |
0.01 |
0.00 |
0.02 |
0.00 |
|
||||||
Price Effect |
-0.02 |
-0.01 |
-0.01 |
-0.01 |
||
|
||||||
FW + Price Effects |
0.00 |
-0.03 |
-0.01 |
-0.01 |
||
|
||||||
Share of series with fund weight declines |
47% |
59% |
40% |
61% |
||
|
||||||
Share of series with price declines |
21% |
9% |
17% |
11% |
||
Fund Weight and Price Effects, and shares of series with fund weight and price declines, are calculated using series where both expense and asset data are available over the specific implementation period. CSA analysis of data obtained from investment fund managers and third-party data providers. Asset and expense data were directly obtained from Investor Economics. Returns data obtained from Morningstar Direct.
Actively managed funds dominated the mutual fund landscape and accounted for 99% of the assets in our study sample (refer to Table 5.6.1). The remaining 1% of assets were in passively managed funds. The lack of traction of passively managed mutual funds in Canada is in stark contrast to the trend seen in the ETF market, where passive funds account for most funds, and in peer jurisdictions, where passively managed funds have a greater share of the mutual fund market. For example, in the United States, 24% of mutual fund assets were in passively managed funds in 2020.{46},{47}
Table 5.6.1 Mutual Fund Assets ($B) by Investing Strategy
Investing Strategy |
2013 |
2014 |
2015 |
2016 |
2017 |
2018 |
2019 |
2020 |
No. of Series |
|
|||||||||
Actively Managed Funds |
538 |
613 |
624 |
661 |
696 |
687 |
733 |
769 |
13,391 |
|
|||||||||
Passively Managed Funds |
7 |
8 |
9 |
10 |
12 |
12 |
14 |
11 |
226 |
|
|||||||||
Total |
545 |
622 |
632 |
671 |
708 |
699 |
747 |
781 |
13,617 |
CSA analysis of data obtained from investment fund managers and third-party data providers. Asset data and data on a fund's investing strategy were obtained from Investor Economics.
The asset-weighted average MERs and management fees steadily and incrementally declined for both actively and passively managed funds throughout our study period (refer to Tables 5.6.2 and 5.6.3). The asset-weighted average MER was above 200 basis points for actively managed funds at the start of our study period, and by the end of our study period the MER had dropped to 169 basis points. In comparison, the asset-weighted average MER for passively managed funds was already below 100 basis points at the start of our study period.
In spite of the decline in the MERs for actively managed funds, their MERs continued to be around 100 basis points higher than the MERs for passively managed funds for most years of our study period.
The difference in the asset-weighted average management fees for actively and passively managed funds averaged 88 basis points over our study period. The difference was largest in 2014 at 97 basis points and smallest at the end of our study period at 84 basis points.
Table 5.6.2 Asset-Weighted Average MERs by Investing Strategy
Investing Strategy |
2013 |
2014 |
2015 |
2016 |
2017 |
2018 |
2019 |
2020 |
Chg '13-'16 |
Chg '17-'20 |
|
||||||||||
Actively Managed Funds |
2.07 |
2.05 |
2.00 |
1.95 |
1.85 |
1.79 |
1.71 |
1.69 |
-0.13 |
-0.16 |
|
||||||||||
Passively Managed Funds |
0.91 |
0.89 |
0.87 |
0.86 |
0.85 |
0.84 |
0.82 |
0.67 |
-0.04 |
-0.18 |
CSA analysis of data obtained from investment fund managers and third-party data providers. Asset and expense data were obtained from Investor Economics. Active and passive categorization made at the fund level and applies to all series within a particular fund.
Table 5.6.3 Asset-Weighted Average Management Fees by Investing Strategy
Investing Strategy |
2013 |
2014 |
2015 |
2016 |
2017 |
2018 |
2019 |
2020 |
Chg '13-'16 |
Chg '17-'20 |
|
||||||||||
Actively Managed Funds |
1.66 |
1.65 |
1.62 |
1.57 |
1.50 |
1.45 |
1.40 |
1.37 |
-0.09 |
-0.13 |
|
||||||||||
Passively Managed Funds |
0.70 |
0.68 |
0.67 |
0.67 |
0.67 |
0.66 |
0.62 |
0.53 |
-0.04 |
-0.14 |
CSA analysis of data obtained from investment fund managers and third-party data providers. Asset and expense data were obtained from Investor Economics. Active and passive categorizations are made at the fund level and applies to all series within a particular fund.
In this section of the report, we only analyze changes to the MERs and management fees for actively managed funds. We have excluded passively managed funds from our analysis due to their small sample size.
Declines were seen in the asset-weighted average MER and management fee for actively managed funds in both the pre- and post-implementation periods (refer to Table 5.6.4). The fee declines ranged from 9 to 13 basis points (or 5% to 6%) for the pre-implementation period and 13 to 16 basis points (or 8% to 9%) for the post-implementation period.
The fund asset weight effect had a larger impact than the price effect in reducing the asset-weighted average MERs/management fees during the pre- and post-implementation periods.
Changes in series' assets arising from sales contributed to lowering the asset-weighted fees while investment returns moved fees slightly in the opposite direction.
The key drivers of the negative interaction effects were the addition and termination of series during the implementation periods.
Table 5.6.4 Changes in the Asset-Weighted (AW) Average MERs and Management Fees for Actively Managed Funds
|
MER |
Management Fee |
||||
|
||||||
|
Chg '13-'16 |
Chg '17-'20 |
Chg '13-'16 |
Chg '17-'20 |
||
|
||||||
AW Avg MER Chg/Mgmt Fee Chg |
-0.13 |
-0.16 |
-0.09 |
-0.13 |
||
|
||||||
Fund Weight (FW) Effect |
-0.09 |
-0.12 |
-0.07 |
-0.10 |
||
|
||||||
|
of which... |
|
|
|
|
|
|
||||||
|
|
Sales Effect |
-0.11 |
-0.14 |
-0.08 |
-0.12 |
|
||||||
|
|
Returns Effect |
0.02 |
0.00 |
0.01 |
0.00 |
|
||||||
Price Effect |
-0.02 |
-0.01 |
-0.01 |
-0.01 |
||
|
||||||
FW + Price Effects |
-0.02 |
-0.02 |
-0.01 |
-0.01 |
||
|
||||||
Share of series with fund weight declines |
42% |
61% |
42% |
61% |
||
|
||||||
Share of series with price declines |
59% |
54% |
17% |
11% |
||
Fund Weight and Price Effects, and shares of series with fund weight and price declines, are calculated using series where both expense and asset data are available over the specific implementation period. CSA analysis of data obtained from investment fund managers and third party data providers. Asset and expense data were obtained from Investor Economics. Returns data obtained from Morningstar Direct. Active categorization made at the fund level and applies to all series within a particular fund.
Mutual funds sponsored by bank-affiliated IFMs{48} and independent IFMs dominated our study sample. Funds sponsored by these two groups of IFMs accounted for 93% to 96% of fund assets during our study period (see Table 5.7.1). Funds sponsored by insurer-affiliated IFMs and professional association IFMs accounted for the balance of fund assets.
Table 5.7.1 Mutual Fund Assets ($B) by IFM Firm Type
IFM Firm Type |
2013 |
2014 |
2015 |
2016 |
2017 |
2018 |
2019 |
2020 |
No. of Series |
|
|||||||||
Association |
6 |
7 |
7 |
7 |
8 |
7 |
7 |
4 |
53 |
|
|||||||||
Bank |
236 |
278 |
286 |
304 |
332 |
334 |
366 |
386 |
3,556 |
|
|||||||||
Independent |
285 |
316 |
316 |
331 |
332 |
321 |
329 |
339 |
8,717 |
|
|||||||||
Insurer |
18 |
21 |
24 |
30 |
35 |
37 |
45 |
51 |
1,291 |
|
|||||||||
Total |
545 |
622 |
632 |
671 |
708 |
699 |
747 |
781 |
13,617 |
CSA analysis of data obtained from investment fund managers and third-party data providers. Asset data were obtained from Investor Economics. IFM firm type classification developed by CSA.
The asset-weighted average MER and management fee steadily declined for all IFM firm types throughout our study period (refer to Tables 5.7.2 and 5.7.3). As our study period progressed, the differences in the asset-weighted average fees between funds sponsored by different IFM firm types narrowed. At the start of our study period, the difference in the asset-weighted average MER across IFM types was 41 basis points. By the end of our study period the difference had narrowed to 14 basis points. For the asset-weighted average management fee the difference was 20 basis points, at the start of our study period, and 4 basis points by the end of our study period.
Some differences in MERs and management fees between the IFM firm types can reflect differences in underlying characteristics of the funds that make up our sample, such as differences in fee structures, investment objectives, and risk preferences.{49} In addition, MER and management expenses can vary across the different fund companies within a particular IFM type. As a result, we caution readers from drawing conclusions about the relative level of fees between different types of IFM firms.
Table 5.7.2 Asset-Weighted Average MERs by IFM Firm Type
IFM Firm Type |
2013 |
2014 |
2015 |
2016 |
2017 |
2018 |
2019 |
2020 |
Chg '13-'16 |
Chg '17-'20 |
|
||||||||||
Bank |
1.84 |
1.86 |
1.85 |
1.81 |
1.75 |
1.69 |
1.65 |
1.61 |
-0.03 |
-0.13 |
|
||||||||||
Independent |
2.25 |
2.19 |
2.12 |
2.06 |
1.93 |
1.87 |
1.76 |
1.76 |
-0.19 |
-0.18 |
|
||||||||||
Insurer |
2.19 |
2.10 |
2.00 |
1.87 |
1.80 |
1.76 |
1.68 |
1.64 |
-0.32 |
-0.17 |
Average for Association funds not shown because to a small number of series in sample for some years. CSA analysis of data obtained from investment fund managers and third-party data providers. Asset and expense data were obtained from Investor Economics.
Table 5.7.3 Asset-Weighted Average Management Fees by IFM Type
IFM Firm Type |
2013 |
2014 |
2015 |
2016 |
2017 |
2018 |
2019 |
2020 |
Chg '13-'16 |
Chg '17-'20 |
|
||||||||||
Bank |
1.54 |
1.57 |
1.56 |
1.51 |
1.46 |
1.41 |
1.38 |
1.35 |
-0.03 |
-0.12 |
|
||||||||||
Independent |
1.74 |
1.70 |
1.66 |
1.60 |
1.52 |
1.46 |
1.41 |
1.39 |
-0.13 |
-0.13 |
|
||||||||||
Insurer |
1.76 |
1.73 |
1.66 |
1.55 |
1.41 |
1.37 |
1.30 |
1.27 |
-0.21 |
-0.14 |
Average for Association funds not shown because to a small number of series in sample for some years. CSA analysis of data obtained from investment fund managers and third-party data providers. Asset and expense data were obtained from Investor Economics.
Our analysis of changes in fees during the pre- and post-implementation periods is confined to bank and independent mutual funds, given that more than 90% of fund assets are concentrated in funds sponsored by these two groups of IFMs.
The asset-weighted average MER/management fee declined for funds sponsored by bank-affiliated IFMs and those sponsored by independent IFMs, in both the pre- and post-implementation periods. The fee declines ranged from 3 to 19 basis points (or 2% to 8%) for the pre-implementation period and 13 to 18 basis points (or 8% to 9%) for the post-implementation period.
Both shifts in the distribution of assets towards lower cost series and reductions in MER/management fee rates contributed to lowering the asset-weighted average fees. Shifts in the distribution of assets, however, had a larger effect than reductions in MER/management fee rates in lowering the asset-weighted average MER/management fee, particularly for funds sponsored by independent IFMs (refer to Tables 5.7.4 and 5.7.5).
Similar to the findings for the other fund characteristics, the interaction effects were relatively small and largely attributable to the addition and termination of series.
Table 5.7.4 Changes in the Asset-Weighted (AW) Average MERs by Select IFM Firm Type
|
Bank |
Independent |
||||
|
||||||
|
Chg '13-'16 |
Chg '17-'20 |
Chg '13-'16 |
Chg '17-'20 |
||
|
||||||
AW Avg MER Chg |
-0.03 |
-0.13 |
-0.19 |
-0.18 |
||
|
||||||
Fund Weight (FW) Effect |
-0.01 |
-0.11 |
-0.14 |
-0.14 |
||
|
||||||
|
of which... |
|
|
|
|
|
|
||||||
|
|
Sales Effect |
-0.03 |
-0.11 |
-0.15 |
-0.13 |
|
||||||
|
|
Returns Effect |
0.02 |
0.00 |
0.01 |
-0.01 |
|
||||||
Price Effect |
-0.02 |
-0.01 |
-0.02 |
-0.01 |
||
|
||||||
FW + Price Effects |
0.00 |
-0.01 |
-0.03 |
-0.03 |
||
|
||||||
Share of series with fund weight declines |
43% |
54% |
41% |
62% |
||
|
||||||
Share of series with price declines |
59% |
55% |
58% |
52% |
||
Fund Weight and Price Effects, and shares of series with fund weight and price declines, are calculated using series where both expense and asset data are available over the specific implementation period. CSA analysis of data obtained from investment fund managers and third-party data providers. Asset and expense data were obtained from Investor Economics. Returns data obtained from Morningstar Direct.
Table 5.7.5 Changes in the Asset-Weighted (AW) Average Management Fees by Select IFM Firm Type
|
Bank |
Independent |
||||
|
||||||
|
Chg '13-'16 |
Chg '17-'20 |
Chg '13-'16 |
Chg '17-'20 |
||
|
||||||
AW Avg Mgmt Fee Chg |
-0.03 |
-0.12 |
-0.13 |
-0.13 |
||
|
||||||
Fund Weight (FW) Effect |
-0.01 |
-0.10 |
-0.11 |
-0.11 |
||
|
||||||
|
of which... |
|
|
|
|
|
|
||||||
|
|
Sales Effect |
-0.03 |
-0.10 |
-0.11 |
-0.11 |
|
||||||
|
|
Returns Effect |
0.02 |
0.00 |
0.01 |
0.00 |
|
||||||
Price Effect |
-0.02 |
0.00 |
-0.01 |
-0.01 |
||
|
||||||
FW + Price Effects |
0.01 |
-0.01 |
-0.02 |
-0.01 |
||
|
||||||
Share of series with fund weight declines |
43% |
54% |
41% |
62% |
||
|
||||||
Share of series with price declines |
28% |
10% |
15% |
9% |
||
Fund Weight and Price Effects, and shares of series with fund weight and price declines, are calculated using series where both expense and asset data are available over the specific implementation period. CSA analysis of data obtained from investment fund managers and third-party data providers. Asset and expense data from Investor Economics. Returns data obtained from Morningstar Direct.
This section of the report examines how ETF fees changed during our study period. We examine ETF fees for the following three fund characteristics: broad asset class, investing strategy, and IFM firm type. A more detailed explanation of our methodology can be found in Appendix A.
The business model and competitive landscape governing the creation, distribution, and management of ETFs in Canada is materially different from the business model and competitive landscape for mutual funds. These differences are reflected in the ongoing costs of owning these two types of investment funds.
The first key material difference is that Canadian-domiciled ETFs are open to competition from abroad, mainly from US-domiciled ETFs. This competitive pressure and the entry of low-cost ETF providers into Canada, starting around 2011, have contributed to keeping ETF costs down.
A second key difference is that the dominant ETF providers have adopted a business model where they do not pay for distribution, in the form of trailing commission to advisers.{50} The adoption of this pricing model can reduce management fees by upwards of 100 basis points, in comparison to the management fees for mutual funds.
The third key difference is the share of ETFs that employ a passively managed investing strategy. In 2020, 84% of ETF assets and 1% of mutual fund assets in our study were passively managed. Passively managed funds have lower costs than actively managed funds. Passively managed funds, by replicating a basket of holdings that underpin the specific benchmarks they are tracking, avoid the additional research and trading costs that arises for actively managed funds. Actively managed funds can have greater research and trading costs than passively managed funds because of the greater need to adjust portfolio holdings as part of efforts to outperform the funds' specific benchmarks.{51}
These three key differences help explain why ongoing costs for ETFs are lower than those for mutual funds. They also explain why the size of the MER and management fee rate declines for ETFs is smaller than those for mutual funds.
These structural differences should be kept in mind when interpreting the findings in this section of the report. We also caution readers from comparing the mutual fund findings to the ETF findings by fund characteristics. While ETFs and mutual funds are both investment funds, there are enough structural differences between them that an equivalent comparison may not be meaningful.
Table 6.2.1, below, summarizes the annual assets of the 389 ETFs in our study sample, and their returns and fees, from 2013 to 2020.
At the start of our study period the 389 ETFs in our study had assets of $54 billion. By the end of our study period, assets had increased by 150% to $136 billion.{52} In contrast, for the same time period mutual fund assets in our sample increased by 43%. In spite of the increase in ETF assets, the investment fund industry in Canada is still dominated by mutual funds. In December 2020, mutual fund assets accounted for 82% of all investment fund assets (mutual funds, ETFs, segregated funds).{53}
There were no clear overall directional trends in ETF returns during our study period. The asset-weighted annualized gross returns were positive for all but two years -- 2015 and 2018 -- and returns ranged from -3.25% to 14.92%. While not a focus of our study, the fees and returns findings indicate that investors owning ETFs realized positive net returns, on average, in 6 of the 8 years of our study period.
The simple average and asset-weighted average MERs and management fees steadily decreased for each year of our study period. The simple average MERs and management fees were higher than the asset-weighted average MERs and management fees. This finding indicates that fund assets were concentrated in funds with lower MERs and management fees. In contrast, the simple average MERs and management fees for mutual funds were lower than the asset-weighted average MERs and management fees, indicating that mutual fund assets were concentrated in funds with higher fees.
Table 6.2.1 ETF Assets, Returns, and Fees, 2013-2020
|
2013 |
2014 |
2015 |
2016 |
2017 |
2018 |
2019 |
2020 |
|
||||||||
Net assets ($B) of funds in study |
54 |
64 |
72 |
92 |
112 |
118 |
141 |
136 |
|
||||||||
Industry assets ($B) |
63 |
77 |
90 |
114 |
147 |
157 |
205 |
257 |
|
||||||||
Share of industry assets (funds in study) |
86% |
83% |
80% |
80% |
76% |
75% |
69% |
53% |
|
||||||||
Number of funds in study |
175 |
189 |
212 |
247 |
318 |
382 |
389 |
323 |
|
||||||||
Number of funds -- industry total |
283 |
340 |
374 |
456 |
554 |
659 |
746 |
853 |
|
||||||||
Share of industry total -- number of fund series in study |
62% |
56% |
57% |
54% |
57% |
58% |
52% |
38% |
|
||||||||
Asset-weighted annualized |
8.65 |
8.94 |
-0.90 |
11.48 |
9.23 |
-3.25 |
14.92 |
9.80 |
|
||||||||
Simple average MER |
0.50 |
0.50 |
0.50 |
0.52 |
0.51 |
0.52 |
0.50 |
0.50 |
|
||||||||
Asset-weighted average MER |
0.37 |
0.36 |
0.35 |
0.34 |
0.33 |
0.33 |
0.31 |
0.29 |
|
||||||||
Simple management fee |
0.46 |
0.45 |
0.44 |
0.43 |
0.43 |
0.43 |
0.43 |
0.43 |
|
||||||||
Asset-weighted average management fee |
0.33 |
0.32 |
0.31 |
0.30 |
0.30 |
0.29 |
0.28 |
0.26 |
CSA analysis of data obtained from third party data providers. Assets, MER, and management fee obtained from Investor Economics. Gross monthly total returns data were obtained from Morningstar Direct. Industry total assets and number of funds obtained from IFIC.
This section of the report presents the research findings for all ETFs, i.e., without grouping the ETFs into different fund characteristics, for the pre- and post-implementation periods.
The asset-weighted average MERs and management fees declined during both the pre- and post-implementation periods (refer to Table 6.3.1). In 2013, the asset-weighted average MER was 37 basis points, and by 2016 it had declined by 3 basis points (or 8%) to 34 basis points. In 2017, the asset-weighted average MER was 33 basis points, and by 2020 it had declined to 29 basis points, which was a 4 basis point (or 12%) decline.
The size of the asset-weighted average management fees declines was similar to the size of the MER declines. In 2013, the asset-weighted average management fee was 33 basis points. By 2016 the asset-weighted average management fee dropped to 30 basis points{54} and stayed at this level in 2017. A further 4 basis points decline (or 13%) was seen by 2020, and the asset-weighted average management fee was 26 basis points in that year.
Shifts in fund assets towards cheaper funds and reductions in the MER/management fee rates, in general, had similar impacts on decreasing the asset-weighted average MER and management fee, for both time periods, while the interaction effect had a muted effect on the size of the overall MER/management fee decline (refer to Table 6.3.1). The interaction effect was close to zero in both study periods.
Table 6.3.1 Changes in Asset Weighted Average MERs and Management Fees, All ETFs, Pre- and Post-Implementation Periods
|
MERs |
Mgmt Fees |
||||
|
||||||
|
Chg '13-'16 |
Chg '17-'20 |
Chg '13-'16 |
Chg '17-'20 |
||
|
||||||
AW Avg MER/Mgmt Fee Chg |
-0.03 |
-0.04 |
-0.03 |
-0.04 |
||
|
||||||
Fund Weight (FW) Effect |
-0.01 |
-0.03 |
-0.01 |
-0.03 |
||
|
||||||
|
of which... |
|
|
|
|
|
|
||||||
|
|
Sales Effect |
0.00 |
-0.03 |
0.00 |
-0.02 |
|
||||||
|
|
Returns Effect |
-0.01 |
0.00 |
-0.01 |
0.00 |
|
||||||
Price Effect |
-0.02 |
-0.01 |
-0.02 |
-0.01 |
||
|
||||||
FW + Price Effects |
-0.01 |
0.00 |
-0.01 |
0.00 |
||
|
||||||
Share of series with fund weight declines |
40% |
58% |
40% |
58% |
||
|
||||||
Share of series with price declines |
36% |
41% |
18% |
11% |
||
Fund Weight and Price Effects, and shares of series with fund weight and price declines, are calculated using series where both expense and asset data are available over the specific implementation period. CSA analysis of data obtained from third party data providers. Assets, MER, and management fee data were obtained from Investor Economics. Gross monthly total returns data were obtained from Morningstar Direct. The individual fund weight, price, and interaction effects (i.e., fund weight and price effects) may not sum to the figure shown in the AW Avg MER/Mgmt Fee Change line due to rounding.
The distribution of ETFs assets by broad asset class is shown below in Table 6.4.1. The dominant asset classes throughout our study period were equity ETFs, which accounted for 63% of ETF assets in 2020, and fixed income ETFs, which accounted for another 34% of ETF assets. The concentration of assets in equity and fixed income funds, and their share of the total assets, remained constant throughout our study period.
Table 6.4.1 ETF Assets ($B) by Broad Asset Class
Broad Asset Class |
2013 |
2014 |
2015 |
2016 |
2017 |
2018 |
2019 |
2020 |
No. of Funds |
|
|||||||||
Balanced |
1 |
1 |
1 |
1 |
1 |
1 |
2 |
1 |
9 |
|
|||||||||
Equity |
33 |
39 |
43 |
56 |
68 |
70 |
83 |
86 |
250 |
|
|||||||||
Fixed Income |
20 |
23 |
27 |
34 |
42 |
45 |
53 |
47 |
127 |
|
|||||||||
Money Market |
0 |
0 |
0 |
0 |
1 |
2 |
3 |
2 |
2 |
|
|||||||||
Other |
0 |
0 |
0 |
0 |
0 |
0 |
0 |
0 |
1 |
|
|||||||||
Total |
54 |
64 |
72 |
92 |
112 |
118 |
141 |
136 |
389 |
CSA analysis of asset and fund classification data obtained from Investor Economics.
The asset-weighted average fees for equity and fixed income ETFs were similar and they steadily declined during our study period (refer to Tables 6.4.2 and 6.4.3). The size of the declines was similar for both the asset-weighted average MERs and management fees, and they ranged from 6 to 9 basis points over 2013-2020.
Table 6.4.2 Asset Weighted Average MERs for Select Broad Asset Class, 2013 to 2020
Broad Asset Class |
2013 |
2014 |
2015 |
2016 |
2017 |
2018 |
2019 |
2020 |
Chg '13-'16 |
Chg '17-'20 |
|
||||||||||
Equity |
0.36 |
0.35 |
0.34 |
0.33 |
0.33 |
0.33 |
0.32 |
0.30 |
-0.03 |
-0.03 |
|
||||||||||
Fixed Income |
0.36 |
0.37 |
0.34 |
0.33 |
0.32 |
0.31 |
0.29 |
0.28 |
-0.03 |
-0.04 |
CSA analysis of asset and fund classification data obtained from Investor Economics.
Table 6.4.3 Asset Weighted Average Management Fees for Select Broad Asset Class, 2013 to 2020
Broad Asset Class |
2013 |
2014 |
2015 |
2016 |
2017 |
2018 |
2019 |
2020 |
Chg '13-'16 |
Chg '17-'20 |
|
||||||||||
Equity |
0.32 |
0.31 |
0.31 |
0.30 |
0.30 |
0.30 |
0.29 |
0.27 |
-0.03 |
-0.03 |
|
||||||||||
Fixed Income |
0.33 |
0.31 |
0.30 |
0.29 |
0.30 |
0.28 |
0.26 |
0.25 |
-0.04 |
-0.05 |
CSA analysis of asset and fund classification data obtained from Investor Economics.
The size of the declines in the asset-weighted average MERs and management fee was similar for equity and fixed income ETFs in both the pre- and post-implementation periods, and they ranged from 3 to 5 basis points, or 7% to 17% (refer to Tables 6.4.4 and 6.4.5).
In general, the price effect had a similar impact to the fund asset-weight effect in reducing the asset-weighted average fees.
The interaction effect had a limited impact on changes in the asset-weighted average fees during both the pre- and post-implementation periods.
Table 6.4.4 Changes in the Asset Weighted (AW) Average MERs for Select Broad Asset Classes
|
Equity |
Fixed Income |
||||
|
||||||
|
Chg '13-'16 |
Chg '17-'20 |
Chg '13-'16 |
Chg '17-'20 |
||
|
||||||
AW Avg MER Chg |
-0.03 |
-0.03 |
-0.03 |
-0.04 |
||
|
||||||
Fund Weight (FW) Effect |
0.00 |
-0.03 |
-0.02 |
-0.03 |
||
|
||||||
|
of which... |
|
|
|
|
|
|
||||||
|
|
Sales Effect |
0.01 |
-0.02 |
-0.01 |
-0.03 |
|
||||||
|
|
Returns Effect |
-0.01 |
0.00 |
0.00 |
0.00 |
|
||||||
Price Effect |
-0.02 |
0.00 |
-0.01 |
-0.02 |
||
|
||||||
FW + Price Effects |
-0.01 |
0.00 |
-0.01 |
0.01 |
||
|
||||||
Share of series with fund weight declines |
35% |
56% |
42% |
60% |
||
|
||||||
Share of series with price declines |
38% |
40% |
36% |
45% |
||
Fund Weight and Price Effects, and shares of series with fund weight and price declines, are calculated using series where both expense and asset data are available over the specific implementation period. CSA analysis of data obtained from third party data providers. Asset, MER, and fund classification data obtained from Investor Economics. Returns data obtained from Morningstar. The individual effects may not add up to the figures shown in the AW Avg MER Chg line due to rounding.
Table 6.4.5 Changes in the Asset Weighted (AW) Average Management Fees for Select Broad Asset Classes
|
Equity |
Fixed Income |
||||
|
||||||
|
Chg '13-'16 |
Chg '17-'20 |
Chg '13-'16 |
Chg '17-'20 |
||
|
||||||
AW Avg Mgmt Fee Chg |
-0.03 |
-0.03 |
-0.04 |
-0.05 |
||
|
||||||
Fund Weight (FW) Effect |
0.00 |
-0.03 |
-0.02 |
-0.01 |
||
|
||||||
|
of which... |
|
|
|
|
|
|
||||||
|
|
Sales Effect |
0.01 |
-0.02 |
-0.02 |
-0.01 |
|
||||||
|
|
Returns Effect |
-0.01 |
0.00 |
0.00 |
0.00 |
|
||||||
Price Effect |
-0.02 |
0.00 |
-0.02 |
-0.03 |
||
|
||||||
FW + Price Effects |
0.00 |
0.00 |
-0.01 |
0.00 |
||
|
||||||
Share of series with fund weight declines |
35% |
56% |
42% |
60% |
||
|
||||||
Share of series with price declines |
16% |
7% |
23% |
19% |
||
Fund Weight and Price Effects, and shares of series with fund weight and price declines, are calculated using series where both expense and asset data are available over the specific implementation period. CSA analysis of data obtained from third party data providers. Asset, management fee, and fund classification data obtained from Investor Economics. Returns data obtained from Morningstar. The individual effects may not add up to the figures shown in the AW Avg Mgmt Fee Chg line due to rounding.
Passively managed ETFs accounted for the largest share of assets (refer to Table 6.5.1). In 2020, 76% of ETF assets were in traditional passively managed funds{55} and another 9% were in passively managed ETFs that follow a strategic beta{56} strategy. Actively managed funds accounted for the remaining 16% of assets, and assets in these ETFs steadily increased during our study period.
Table 6.5.1 ETF Assets ($B) by Investing Strategy
Investing Strategy |
2013 |
2014 |
2015 |
2016 |
2017 |
2018 |
2019 |
2020 |
No. of Funds |
|
|||||||||
Active |
3 |
4 |
6 |
11 |
15 |
19 |
25 |
21 |
115 |
|
|||||||||
Passive |
46 |
52 |
58 |
71 |
84 |
86 |
101 |
103 |
165 |
|
|||||||||
Passive -- Strategic Beta |
6 |
7 |
8 |
10 |
13 |
13 |
15 |
12 |
109 |
|
|||||||||
Total |
54 |
64 |
72 |
92 |
112 |
118 |
141 |
136 |
389 |
CSA analysis of asset and fund classification data obtained from Investor Economics.
The asset-weighted average fees steadily decreased for passively managed and strategic beta ETFs during our study period (refer to Tables 6.5.2 and 6.5.3). Actively managed ETFs and strategic beta ETFs had similar asset-weighted average MERs throughout our study period, and they were 25-32 basis points higher than passively managed ETFs. The asset-weighted average management fee for strategic beta ETFs was higher than the fee for actively managed ETFs for most of our study period, and the difference averaged 2 basis points. The asset-weighted average management fees for passively managed funds were on average 24 basis points lower than the fees for actively managed or strategic beta funds. The largest differences in the asset-weighted average fees for ETFs were seen for this fund characteristic.
Table 6.5.2 Asset Weighted Average MERs by Investing Strategy, 2013 to 2020
Investing Strategy |
2013 |
2014 |
2015 |
2016 |
2017 |
2018 |
2019 |
2020 |
Chg '13-'16 |
Chg '17-'20 |
|
||||||||||
Active |
0.61 |
0.59 |
0.56 |
0.53 |
0.56 |
0.55 |
0.51 |
0.54 |
-0.08 |
-0.02 |
|
||||||||||
Passive |
0.32 |
0.31 |
0.30 |
0.28 |
0.26 |
0.25 |
0.23 |
0.21 |
-0.05 |
-0.04 |
|
||||||||||
Passive -- Strategic Beta |
0.60 |
0.58 |
0.56 |
0.54 |
0.53 |
0.52 |
0.51 |
0.49 |
-0.06 |
-0.04 |
CSA analysis of asset and fund classification data obtained from Investor Economics.
Table 6.5.3 Asset Weighted Average Management Fees by Investing Strategy, 2013 to 2020
Investing Strategy |
2013 |
2014 |
2015 |
2016 |
2017 |
2018 |
2019 |
2020 |
Chg '13-'16 |
Chg '17-'20 |
|
||||||||||
Active |
0.50 |
0.49 |
0.47 |
0.44 |
0.47 |
0.47 |
0.44 |
0.48 |
-0.06 |
0.01 |
|
||||||||||
Passive |
0.30 |
0.27 |
0.26 |
0.25 |
0.24 |
0.23 |
0.21 |
0.19 |
-0.05 |
-0.05 |
|
||||||||||
Passive -- Strategic Beta |
0.55 |
0.54 |
0.53 |
0.49 |
0.48 |
0.46 |
0.46 |
0.44 |
-0.06 |
-0.04 |
CSA analysis of asset and fund classification data obtained from Investor Economics.
The pre-implementation decreases in the asset-weighted average MERs and management fees, in general, were greater than the post-implementation decreases for all three investing strategies (refer to Tables 6.5.4 and 6.5.5). The size of the decreases ranged from 5 to 8 basis points (or 9% to 16%) for the pre- implementation period, and 1 to 5 basis points (or 2% to 19%) for the post-implementation period. In general, the fund asset weight effect had a larger impact than the price effect in decreasing the asset-weighted average MERs and management fees, especially for the pre-implementation period.
Even though there was a subset of funds with declines in their MERs, these declines were not sufficiently large enough to shift the aggregated asset-weighted average MERs lower. As a result, the price effects for ETFs by investing strategy were around zero.
In general, the addition and termination of series over the implementation periods, and simultaneous changes in the distribution of assets across funds and to funds' MER/management fee rates, drove the interaction effects across the different investing strategies.
Table 6.5.4 Changes in the Asset Weighted (AW) Average MERs by Investing Strategy
|
Active |
Passive |
Passive -- Strategic Beta |
|||||
|
||||||||
|
Chg '13-'16 |
Chg '17-'20 |
Chg '13-'16 |
Chg '17-'20 |
Chg '13-'16 |
Chg '17-'20 |
||
|
||||||||
AW Avg MER Chg |
-0.08 |
-0.02 |
-0.05 |
-0.04 |
-0.06 |
-0.04 |
||
|
||||||||
Fund Weight (FW) Effect |
-0.09 |
-0.01 |
-0.01 |
-0.03 |
-0.05 |
-0.01 |
||
|
||||||||
|
of which... |
|
|
|
|
|
|
|
|
||||||||
|
|
Sales Effect |
-0.09 |
-0.01 |
0.00 |
-0.03 |
-0.05 |
0.00 |
|
||||||||
|
|
Returns Effect |
0.00 |
0.00 |
-0.01 |
0.00 |
0.00 |
0.00 |
|
||||||||
Price Effect |
0.00 |
-0.01 |
-0.02 |
-0.01 |
0.00 |
-0.01 |
||
|
||||||||
FW + Price Effects |
0.01 |
0.00 |
-0.02 |
-0.01 |
-0.01 |
-0.02 |
||
|
||||||||
Share of series with fund weight declines |
66% |
62% |
37% |
56% |
36% |
52% |
||
|
||||||||
Share of series with price declines |
38% |
54% |
42% |
30% |
20% |
45% |
||
Fund Weight and Price Effects, and shares of series with fund weight and price declines, are calculated using series where both expense and asset data are available over the specific implementation period. CSA analysis of data obtained from third party data providers. Asset, MER, and fund classification data obtained from Investor Economics. Returns data obtained from Morningstar. The individual effects may not add up to the figures shown in the AW Avg MER Chg line due to rounding.
Table 6.5.5 Changes in the Asset Weighted (AW) Average Management Fees by Investing Strategy
|
Active |
Passive |
Passive -- Strategic Beta |
|||||
|
||||||||
|
Chg '13-'16 |
Chg '17-'20 |
Chg '13-'16 |
Chg '17-'20 |
Chg '13-'16 |
Chg '17-'20 |
||
|
||||||||
AW Avg Mgmt Fee Chg |
-0.06 |
0.01 |
-0.05 |
-0.05 |
-0.06 |
-0.04 |
||
|
||||||||
Fund Weight (FW) Effect |
-0.08 |
0.01 |
-0.01 |
-0.02 |
-0.03 |
-0.01 |
||
|
||||||||
|
of which... |
|
|
|
|
|
|
|
|
||||||||
|
|
Sales Effect |
-0.07 |
0.01 |
0.00 |
-0.02 |
-0.03 |
-0.01 |
|
||||||||
|
|
Returns Effect |
0.00 |
0.00 |
-0.01 |
0.00 |
0.00 |
0.00 |
|
||||||||
Price Effect |
0.00 |
0.00 |
-0.02 |
-0.01 |
-0.01 |
-0.01 |
||
|
||||||||
FW + Price Effects |
0.01 |
0.00 |
-0.01 |
-0.01 |
-0.02 |
-0.02 |
||
|
||||||||
Share of series with fund weight declines |
66% |
62% |
37% |
56% |
36% |
52% |
||
|
||||||||
Share of series with price declines |
4% |
13% |
26% |
9% |
8% |
13% |
||
Fund Weight and Price Effects, and shares of series with fund weight and price declines, are calculated using series where both expense and asset data are available over the specific implementation period. CSA analysis of data obtained from third party data providers. Asset, management fee, and fund classification data obtained from Investor Economics. Returns data obtained from Morningstar. The individual effects may not add up to the figures shown in the AW Avg Mgmt Fee Chg line due to rounding.
This section of the report examines ETF fees by IFM firm type. The three types of IFM firms were bank-affiliated IFMs, independent IFMs, and insurer-affiliated IFMs. Of the 389 funds in our study sample, 284 were sponsored by independent IFMs, 92 were sponsored by bank-affiliated IFMs, and 13 were sponsored by insurer-affiliated IFMs (refer to Table 6.6.1). The sample size of ETFs sponsored by insurer-affiliated IFMs was too small for the findings to be representative of the universe of funds sponsored by this group of IFMs. We therefore excluded these 13 funds from our detailed fees analysis.
ETFs sponsored by independent IFMs accounted for 74% of fund assets, in 2020, while those sponsored by bank-affiliated accounted for the remaining 26% of fund assets (refer to Table 6.6.1). In contrast, mutual fund assets were more evenly distributed between funds sponsored by bank-affiliated IFMs (49% of assets in 2020) and independent IFMs (43% of assets).
Table 6.6.1 ETF Assets ($B) by Select IFM Firm Type
IFM Firm Type |
2013 |
2014 |
2015 |
2016 |
2017 |
2018 |
2019 |
2020 |
No. of Funds Series |
|
|||||||||
Bank |
10 |
13 |
16 |
24 |
29 |
31 |
38 |
35 |
92 |
|
|||||||||
Independent |
45 |
51 |
56 |
68 |
82 |
86 |
103 |
101 |
284 |
|
|||||||||
Total |
54 |
64 |
72 |
92 |
111 |
118 |
141 |
136 |
376 |
CSA analysis of asset data obtained from Investor Economics. IFM firm type categories developed by CSA.
The asset-weighted average fees steadily decreased for funds sponsored by bank-affiliated IFMs and independent IFMs (hereinafter independent ETFs) during our study period (refer to Tables 6.6.2 and 6.6.3). As was the case for our mutual funds results, we caution readers from drawing conclusions about the relative level of fees between different types of IFM types, as these can reflect differences in underlying characteristics of the funds that make up our sample.{57}
Table 6.6.2 Asset Weighted Average MERs by Select IFM Firm Type, 2013 to 2020
IFM Firm Type |
2013 |
2014 |
2015 |
2016 |
2017 |
2018 |
2019 |
2020 |
Chg '13-'16 |
Chg '17-'20 |
|
||||||||||
Bank |
0.43 |
0.41 |
0.38 |
0.36 |
0.35 |
0.35 |
0.33 |
0.33 |
-0.07 |
-0.02 |
|
||||||||||
Independent |
0.35 |
0.35 |
0.34 |
0.33 |
0.32 |
0.31 |
0.30 |
0.27 |
-0.02 |
-0.05 |
CSA analysis of asset data obtained from Investor Economics. IFM firm type categories developed by CSA.
Table 6.6.3 Asset Weighted Average Management Fees by Select Firm Type, 2013 to 2020
IFM Firm Type |
2013 |
2014 |
2015 |
2016 |
2017 |
2018 |
2019 |
2020 |
Chg '13-'16 |
Chg '17-'20 |
|
||||||||||
Bank |
0.38 |
0.35 |
0.33 |
0.32 |
0.31 |
0.33 |
0.30 |
0.30 |
-0.06 |
-0.01 |
|
||||||||||
Independent |
0.32 |
0.31 |
0.30 |
0.29 |
0.29 |
0.28 |
0.27 |
0.25 |
-0.03 |
-0.05 |
CSA analysis of asset data obtained from Investor Economics. IFM firm type categories developed by CSA.
The decreases in the asset-weighted average MERs and management fees for ETFs sponsored by bank affiliates were greater for the pre-implementation period than the post-implementation period (refer to Tables 6.6.4 and 6.6.5). This trend was generally reversed for independent ETFs. Declines in the asset-weighted average MERs ranged from 2 to 7 basis points (or 7% to 17%) and 1 to 5 basis points (or 3% to 17%) for the asset weighted average management fees.
Within each IFM grouping, the size of the fund asset weight and price effects were relatively similar for both time periods. As a result, these effects had a similar sized impact in lowering the asset-weighted average MERs or management fees.
The positive interaction effects for ETFs sponsored by bank affiliated IFMs were caused by the creation and termination of series. The interaction effects for independent ETFs were small in both periods.
Table 6.6.4 Changes in the Asset Weighted (AW) Average MERs for Select IFM Firm Type
|
Bank |
Independent |
||||
|
||||||
|
Chg '13-'16 |
Chg '17-'20 |
Chg '13-'16 |
Chg '17-'20 |
||
|
||||||
AW Avg MER Chg |
-0.07 |
-0.02 |
-0.02 |
-0.05 |
||
|
||||||
Fund Weight (FW) Effect |
-0.04 |
-0.04 |
0.00 |
-0.03 |
||
|
||||||
|
of which... |
|
|
|
|
|
|
||||||
|
|
Sales Effect |
-0.03 |
-0.04 |
0.00 |
-0.02 |
|
||||||
|
|
Returns Effect |
-0.01 |
0.00 |
-0.01 |
0.00 |
|
||||||
Price Effect |
-0.05 |
-0.01 |
-0.01 |
-0.01 |
||
|
||||||
FW + Price Effects |
0.01 |
0.04 |
-0.01 |
-0.01 |
||
|
||||||
Share of series with fund weight declines |
50% |
69% |
40% |
56% |
||
|
||||||
Share of series with price declines |
75% |
46% |
23% |
40% |
||
Fund Weight and Price Effects, and shares of series with fund weight and price declines, are calculated using series where both expense and asset data are available over the specific implementation period. CSA analysis of data obtained from third party data providers. Asset and MER data obtained from Investor Economics. Returns data obtained from Morningstar. IFM firm type categories developed by CSA. The individual effects may not add up to the figures shown in the AW Avg MER Chg line due to rounding.
Table 6.6.5 Changes in the Asset Weighted (AW) Average Management Fees for Select IFM Firm Type
|
Bank |
Independent |
||||
|
||||||
|
Chg '13-'16 |
Chg '17-'20 |
Chg '13-'16 |
Chg '17-'20 |
||
|
||||||
AW Avg Mgmt Fee Chg |
-0.06 |
-0.01 |
-0.03 |
-0.05 |
||
|
||||||
Fund Weight (FW) Effect |
-0.03 |
-0.02 |
-0.01 |
-0.03 |
||
|
||||||
|
of which... |
|
|
|
|
|
|
||||||
|
|
Sales Effect |
-0.03 |
-0.02 |
0.00 |
-0.02 |
|
||||||
|
|
Returns Effect |
-0.01 |
0.00 |
-0.01 |
0.00 |
|
||||||
Price Effect |
-0.04 |
0.00 |
-0.02 |
-0.02 |
||
|
||||||
FW + Price Effects |
0.01 |
0.02 |
-0.01 |
-0.01 |
||
|
||||||
Share of series with fund weight declines |
50% |
69% |
40% |
56% |
||
|
||||||
Share of series with price declines |
16% |
6% |
18% |
13% |
||
Fund Weight and Price Effects, and shares of series with fund weight and price declines, are calculated using series where both expense and asset data are available over the specific implementation period. CSA analysis of data obtained from third-party data providers. Asset and management fee data obtained from Investor Economics. Returns data obtained from Morningstar. IFM firm type categories developed by CSA. The individual effects may not add up to the figures shown in the AW Avg MER Chg line due to rounding.
This section of the report answers the three research questions that guided our research and analysis, and our concluding observations of the research findings.
Research question 1: Have investment fund managers (IFMs) lowered fees, specifically the management expense ratio (MER) and management fee, and what are the extent of these changes? |
Investment fund managers have been lowering the MERs and management fees for both mutual funds and ETFs, and the extent of these changes varied by investment fund type and fund characteristics.
For mutual funds, the aggregate asset-weighted average MER declined by 38 basis points (or 19%) over our study period, and between 13 and 49 basis points or between 6% and 30%, across the fund characteristics examined. The size of the asset weighted average management fee declines was smaller, at 29 basis points for the overall study sample and ranging from 6 to 39 basis points across the main fund characteristics, or between 4% to 32%.
ETFs, compared to mutual funds, had smaller declines in their asset-weighted average MERs and management fees during our study period. This finding was anticipated since the MERs and management fees for ETFs were starting from a lower baseline level, primarily because the MERs/management fees of ETFs do not include embedded trailing commissions, and they generally employ a passively managed investing strategy. By the end of our study period in 2020, the asset-weighted average MER for our total sample decreased by 8 basis points (or 21%) from 2013 levels, and between 6 to 11 basis points, or 12% to 34%, depending on fund characteristic. The decrease in the asset-weighted average management fee for our total sample was 7 basis points (22%) between 2013 and 2020. Across the main fund characteristics, the declines in asset weighted average management fee ranged from 3 to 10 basis points, or 5% to 34%.
Research question 2: Have product manufacturers and product distributors been shifting to products that are not captured by the new account cost and performance disclosures? |
Our analysis of Canadian household discretionary financial assets did not show a trend of discretionary financial assets moving towards products not captured by the CRM2 annual costs and performance report requirements.
Research question 3: What have been the changes in product creation and distribution trends, generally? |
Five notable market shifting changes in product creation and distribution occurred during our study period. These were:
i) the increasing popularity of fund-of-fund products, reflected in the growth of fund wrap programs
ii) growth of the ETF market, and in the number of actively managed and strategic/smart beta ETFs
iii) continued growth in fee-based mutual fund series, and a corresponding shift in assets from commission-based to fee-based fund series
iv) the rise of funds with an ESG mandate, and
v) the rise of online advisers
While our findings provide important directional trends, i.e., correlation rather than cause and effect outcomes, we caution readers from drawing conclusions that the changes presented in this report were caused by the CRM2 annual costs and performance reports. It is possible that other factors, which we could not practically account for in our analysis, also contributed to the changes we have highlighted. These factors could include: advertising by firms competing on fees; local and national news stories focused on fees, cost effective investments, and the best interest discussion in Canada; increasing investor interest in passive investment funds and online advisers; and improvements in market conditions.
Keeping these limitations in mind, our findings for these three research questions appear to indicate that industry behaviour, overall, has been shifting in directions that are congruent with our hypothesis about the effect of the CRM2 regulations, and help provide evidence that disclosure-based regulations may be an effective tool in changing industry behaviour.
This section of the report provides an overview of the study's research design and fees methodology.
We analyze the following main fund characteristics (and their sub-fund characteristics) on mutual fund and ETF fees:
1) Broad asset class: The broad asset classes are balanced, equity, fixed income, money market and other.{58}
2) Product type (for mutual funds only): The product types for mutual funds are stand-alone funds and three categories of fund-of-funds (FoF), specifically, proprietary FoF, 3rd party FoF, and proprietary and 3rd party FoF. ETFs do not have the same product type categories that exist for mutual funds. As such, there is no product type analysis for ETFs.
3) Fund investing strategy: The investing strategy for mutual funds are actively managed funds and passively managed funds. The investing strategy for ETFs includes an additional category -- strategic beta funds. Strategic beta ETFs are in their own category as they are neither purely actively nor passively managed funds.{59}
4) IFM firm type: IFM firm type describes the mutual fund or ETF manufacturers who create and promote mutual funds and ETFs. Our analysis categorizes these manufacturers, i.e., investment fund managers, into four groupings: bank-affiliated IFMs{60}, insurer-affiliated IFMs, independent IFMs, and professional association IFMs.
5) Series/class type (for mutual funds only): The mutual fund industry does not use a standardized approaching in naming mutual fund series/classes. Mutual fund series included in our analysis are so called A, adviser, D, F, O, and T series of funds.{61} These series types are designed for retail investors.
For each fund characteristic we analyze changes in MERs and management fees before and after the CRM2 annual costs and performance report requirements were fully implemented. The pre-implementation period is from 2013 to 2016 and the post-implementation period is from 2017 to 2020. For each fund characteristic we do not present the findings for every sub-fund characteristic through the pre- and post-implementation lens. The decision of what sub-fund characteristic findings to include or exclude was determined by that sub-fund characteristic's share of the total mutual fund/ETF assets. For example, in our mutual fund analysis of fees by broad asset class we excluded money market funds from our detailed analysis as they only accounted for 1% of mutual fund assets.
Our MER and management fee analysis includes a subset of the entire universe of mutual funds and ETFs. Data availability limitations meant that only a subset of funds could be included in our analysis. Our analysis is underpinned by data obtained from multiple sources, including directly from investment fund managers and third-party data vendors. Third-party data vendors we relied on were Investor Economics, an ISS Market Intelligence company, and Morningstar.
Our analysis of mutual funds includes 2,991 funds and they accounted for 44% to 65% of mutual fund assets throughout our study period.{62} Three hundred eighty-nine (389) ETFs are included in our analysis and these funds accounted for 53% to 86% of all ETF assets throughout our study period.
The mutual fund analysis excludes fund series created for institutional investors. The ETF analysis includes institutional assets as we did not have information that would enable us to easily separate institutional assets from retail investor assets. Additionally, the ETFs only include Canadian listed ETFs.
The data sets that underpin our analysis were obtained directly from investment fund managers and third-party data providers, specifically Investor Economics and Morningstar. Our data sets contained a total of 3,703 unique mutual funds for our study period. After filtering the funds by our selection criteria and eliminating funds with obvious reporting errors{63} and missing data points our final sample size was 2,991 mutual funds and 389 ETFs. The 2,991 mutual funds were comprised of 14,159 unique fund series.
The following mutual fund data points, covering a time period of 2013 to 2019, were sourced directly from investment fund managers:
• Assets, sales, redemptions, switches
• Product type
• CIFSC classification
The following data points were sourced from Investor Economics:
• Asset data{64}
• MER
• Management fee
• Series type classification
• Investing strategy
• CIFSC classification (for ETFs only)
Monthly returns data were sourced from Morningstar Direct.
The following criteria were used to select ETFs and mutual funds for inclusion in our analysis.
• The funds are domiciled in Canada and sold to Canadian investors
• Mutual funds must be open-ended funds
• ETFs are Canadian listed ETFs
• Each fund must have gross monthly total return data for at least 36 consecutive months, between 2009 and 2020.{65} Terminated and merged funds are included in our sample population if they can satisfy the monthly performance data criteria. These criteria were included to minimize survivorship bias in our sample population.
• The funds must have MER{66} and management fee data from 2013 to 2020.
Fees were analyzed using the asset weighted average of funds in our sample population, on an annual basis.
Our MER and management fee data were at the series/class level, for mutual funds. Mutual fund series included in our analysis were series A, D, F, O, T, and advisor series funds.
We calculated the asset-weighted series level MER and management fee for each fund in our study sample and then summed the results for all funds to obtain the aggregated asset weighted average MER/management fee for the entire study sample. The asset data used to calculate each fund's series level asset weight was obtained from Investor Economics and are at December.{67}
For each fund we calculated an overall asset weight and an asset weight for each fund characteristic examined in our research. Each mutual fund series had a total of 6 weights:
1. an overall asset weight
2. a series type weight
3. a broad asset class weight
4. a product type weight
5. an investing strategy weight and
6. an IFM firm type weight.
ETFs in general do not have different series types. As such, our MER and management fee data, and asset weighting calculations were at the fund level. Each ETF in our analysis had 4 unique fund weights, an overall asset weight and three fund characteristics weights, one for broad asset class, one for investing strategy and one for IFM firm type.
The next section provides a detailed description of the formulas used in our analysis to calculate changes in MERs and management fees, including the formulas for calculating the fund weight, sales, returns, price, and interaction effects.
The formulas for calculating changes in the simple average and asset-weighted MER and management fee are the following:
• Change in the simple average between time periods
where m is the given MER or management fee for fund i at time t, and n is the number of funds in the study
• Change in the asset-weighted average between time periods
where w is the weight of fund i at time t is given as the assets a at time t as a percentage of total assets
The asset-weighted average changes are further deconstructed into three sub-components: changes in fund asset weighting, changes in fund pricing, i.e., MER or management fee rates, and changes arising from the interaction of fund weighting and fund pricing. The formulas for each component are below.
• Changes in the fund asset weighting
• Change in fund pricing, i.e., MER or management fee rate changes:
• Changes arising from the interaction of fund weighting and fund pricing:
We further deconstruct changes in the fund asset weighting component to calculate the effect of fund sales and fund returns{68} on the change in asset-weighted MERs and management fees using the following formulas:
• Fund sales effect:
where r denotes the rate of return of fund i at period t and s denotes the net sales rate of fund i at period t
• Fund returns effect:
This appendix explains the three effects examined in our study and how to interpret them.
The following equation captures the relationship of the fund asset weight, price, and interaction effects in relation to changes in the aggregated asset weighted average MER/management fee, for all fund series.
Change in the aggregated asset weighted average MER/management fee{69} (for a given time period) = sum of fund asset weight effect + sum of price effect + sum of interaction effect |
The fund asset weight effect measures how increases or decreases in each series' assets, between two time periods, contributed to changes in the aggregated asset-weighted average MER or management fee, while holding the series' MER or management fee constant.{70} An increase (decrease) in the fund asset weight effect reflects a shift in the distribution of assets in our sample towards series which had higher (lower) MERs or management fees at the start of the period looked at.{71} Increases (decreases) in a fund asset weight effect will lead to a corresponding increase (decrease) in its asset-weighted average MER/management fee.
Series with more assets will have a higher fund asset weight than series with fewer assets. As such, the aggregated asset-weighted average MERs or management fees will always be weighted towards the MERs or management fees of fund series with larger asset sizes. Each mutual fund series has 6 unique fund asset weights -- an overall weight, and a weight for each fund characteristic that we analyzed.{72}
Within the fund asset weight effect, we break down how asset changes arising from sales and investment returns contribute to this effect. Increases (decreases) in a fund series' assets attributable to sales or returns, between two time periods, will lead to a corresponding increase (decrease) in the fund's asset weighted average MER/management fee.
The price effect measures how changes in a fund series' MER or management fee contributed to changes in the aggregated asset-weighted average MER or management fee, for all fund series. The price effect calculation holds a fund series' asset weight constant, while accounting for changes in its MER or management fee, between two time periods.{73}
The terms prices and fees are used interchangeably throughout our report. These terms should be interpreted to mean MERs/management fees and not the price for a unit of a mutual fund or ETF, unless otherwise noted.
The interaction effect measures how simultaneous changes in a fund series' MER/management fee and fund asset weight, between two time periods, contributed to changes in the aggregated asset weighted average MER or management fee, for all fund series. In other words, the interaction effect is measuring the impacts of two variable changes at once rather than a single variable change, which is the procedure used to measure the fund asset weight and price effects.
Figure 1, below, illustrates how the directional change of each effect for a series contributes to the directional changes in the aggregated asset weighted average MERs or management fees, before the impacts of the other effects are netted out and assuming no changes to other series in the sample. A total of thirtheen possible scenarios are illustrated for the fund asset weight, price, and interaction effects{74}, and the three corresponding directional changes in the aggregated asset-weighted average MERs or management fees of these effects. The directional changes are an increase, decrease, or no change in the asset-weighted average MERs or management fees.
The four most common scenarios encountered in our study were:
• decreases in the asset-weighted average MERs/management fees, all else equal, that were attributable to i) declines in the share of total assets for a subset of series with higher fees than other series in our sample (scenario 1 in Figure 1) or ii) declines in the MER/management fee rates for a subset of series (scenario 6 in Figure 1).
• increases in the asset-weighted average MERs/management fees, all else equal, that were attributable to i) the addition of new series{75} (scenario 9 in Figure 1) or ii) simultaneous decreases in a series' assets and MER/management fee rates (scenario 10 in Figure 1).
The directional changes in the fund asset weight, price, and interaction effects, and their contribution to the directional changes in the aggregated asset weighted average MERs/management fees, illustrated in Figure 1, is for the specified effect.
The direction of the overall asset-weighted average MERs/management fees, i.e., whether it increases or decreases, depends on how the size and direction of each effect collectively net out.
For example, in Table 5.4.5, in section 5 of the report, the overall aggregated asset weighted average management fee for the "Series A" of mutual funds increased by 2 basis points during the pre-implementation period. The fund asset weight and price effects contributed to decreasing the overall aggregated asset weighted average management fee by 2 and 4 basis points, respectively, for a combined decrease of 6 basis points. The interaction effect, however, increased the overall aggregated asset weighted management fee by 8 basis points. These 8 basis points offset the 6 basis points decline attributable to the combined fund asset weight and price effects.
It is this netted aggregated asset weighted average MER and management fee that is presented in the top row of the tables in sections 5 and 6 of the report{76}.
Figure 1: Impact of Directional Changes in a Series' Fund Asset Weight and/or MERs/Management Fees on the Aggregated Asset Weighted Average MERs/Management Fees{*}
Effect |
Direction of Fund Weight or Fee Change Between 2013-2016 or 2017-2020 |
|
Impact on the Aggregated Asset Weighted Average MERs/Management Fees for the Specified Effect{**} |
||
|
|||||
Main effect 1 -- Fund Weight Effect |
Fund weight decreases & MER/management fee is above asset weighted average (scenario 1) |
|
Leads to ... |
Decreases in asset-weighted average MERs/management fees |
|
|
|||||
(measuring 1 effect on the asset weighted average MERs/management fees -- changes in fund weights){***} |
Fund weight decreases & MER/management fee is below asset weighted average (scenario 2) |
|
Leads to ... |
Increases in asset weighted average MERs/management fees |
|
|
|||||
|
Fund weight increases & MER/management fee is below asset weighted average (scenario 3) |
|
Leads to ... |
Decreases in asset weighted average MERs/management fees |
|
|
|||||
|
Fund weight increases & MER/management fee is above asset weighted average (scenario 4) |
|
Leads to ... |
Increases in asset weighted average MERs/management fees |
|
|
|||||
|
No changes in fund weight (scenario 5) |
|
Leads to ... |
No impact on asset weighted average MERs/management fees |
|
|
|||||
Main effect 2 -- Price Effect |
MER/management fee decreases (scenario 6) |
|
Leads to ... |
Decreases in asset weighted average MERs/management fees |
|
|
|||||
(measuring 1 effect on the asset weighted average MERs/management fees -- changes in MER/management fee rates) |
MER/management fee increases (scenario 7) |
|
Leads to ... |
Increases in asset weighted average MERs/management fees |
|
|
|||||
|
No changes in MER/management fee (scenario 8) |
|
Leads to ... |
No impact on asset weighted average MERs/management fees |
|
|
|||||
Interaction Effect -- Fund Weight Effect & Price Effect |
Fund weight increases & MER/management fee increases (scenario 9) |
|
Leads to ... |
Increases in asset weighted average MERs/management fees |
|
|
|||||
(measuring 2 effects on the asset weighted average MERs/management fees -- changes in fund weights & changes in MER/management fee weights){***} |
Fund weight decreases & MER/management fee decreases (scenario 10) |
|
Leads to ... |
Increases in asset weighted average MERs/management fees |
|
|
|||||
|
Fund weight increases & MER/management fee decreases (scenario 11) |
|
Leads to ... |
Decreases in asset weighted average MERs/management fees |
|
|
|||||
|
Fund weight decreases & MER/management fee increases (scenario 12) |
|
Leads to ... |
Decreases in asset weighted average MERs/management fees |
|
|
|||||
|
No changes in fund weight & MER/management fee (scenario 13) |
|
Leads to ... |
No impact on asset weighted average MERs/management fees |
|
This section of the appendices provides supplemental data tables that show the asset weighted average fees and number of funds for all sub-categories of a fund characteristic.
Appendix -- Table 5.3.2 Asset Weighted Average MERs by Broad Asset Class, 2013 to 2020
Broad Asset Class |
2013 |
2014 |
2015 |
2016 |
2017 |
2018 |
2019 |
2020 |
Chg '13-'16 |
Chg '17-'20 |
|
||||||||||
Balanced |
2.10 |
2.07 |
2.03 |
1.98 |
1.90 |
1.85 |
1.79 |
1.78 |
-0.12 |
-0.12 |
|
||||||||||
Equity |
2.22 |
2.17 |
2.12 |
2.05 |
1.94 |
1.87 |
1.77 |
1.74 |
-0.17 |
-0.19 |
|
||||||||||
Fixed Income |
1.46 |
1.40 |
1.35 |
1.28 |
1.19 |
1.13 |
1.06 |
1.02 |
-0.18 |
-0.17 |
|
||||||||||
Money Market |
0.42 |
0.42 |
0.44 |
0.44 |
0.44 |
0.42 |
0.42 |
0.37 |
0.02 |
-0.07 |
|
||||||||||
Other |
2.64 |
2.36 |
2.18 |
2.10 |
1.92 |
1.66 |
1.58 |
1.69 |
-0.54 |
-0.22 |
CSA analysis of data obtained from investment fund managers and third-party data providers. Asset and expense data from Investor Economics.
Appendix -- Table 5.3.3 Asset Weighted Average Management Fees by Broad Asset Class, 2013 to 2020
Broad Asset Class |
2013 |
2014 |
2015 |
2016 |
2017 |
2018 |
2019 |
2020 |
Chg '13-'16 |
Chg '17-'20 |
|
||||||||||
Balanced |
1.69 |
1.69 |
1.65 |
1.62 |
1.55 |
1.50 |
1.47 |
1.45 |
-0.08 |
-0.10 |
|
||||||||||
Equity |
1.75 |
1.73 |
1.70 |
1.63 |
1.55 |
1.49 |
1.44 |
1.41 |
-0.12 |
-0.14 |
|
||||||||||
Fixed Income |
1.20 |
1.16 |
1.11 |
1.04 |
0.97 |
0.91 |
0.85 |
0.82 |
-0.16 |
-0.15 |
|
||||||||||
Money Market |
0.36 |
0.36 |
0.37 |
0.37 |
0.36 |
0.35 |
0.37 |
0.36 |
0.01 |
0.00 |
|
||||||||||
Other |
1.83 |
1.75 |
1.64 |
1.52 |
1.39 |
1.24 |
1.17 |
1.15 |
-0.31 |
-0.23 |
CSA analysis of data obtained from investment fund managers and third-party data providers. Asset and expense data were obtained from Investor Economics.
Number of Fund Series by IFM Firm Type and Broad Asset Class
IFM Firm Type |
Balanced |
Equity |
Fixed Income |
Money Market |
Other |
Total |
|
||||||
Association |
17 |
27 |
8 |
1 |
0 |
53 |
|
||||||
Bank |
1,255 |
1,682 |
543 |
21 |
55 |
3,556 |
|
||||||
Independent |
2,839 |
4,681 |
921 |
77 |
199 |
8,717 |
|
||||||
Insurer |
544 |
500 |
220 |
11 |
16 |
1,291 |
|
||||||
Total |
4,655 |
6,890 |
1,692 |
110 |
270 |
13,617 |
Appendix -- Table 5.4.2 Asset Weighted Average MERs by Series Type, 2013-2020
Series Type |
2013 |
2014 |
2015 |
2016 |
2017 |
2018 |
2019 |
2020 |
Chg '13-'16 |
Chg '17-'20 |
|
||||||||||
A |
2.15 |
2.14 |
2.12 |
2.10 |
2.06 |
2.06 |
2.01 |
2.02 |
-0.05 |
-0.04 |
|
||||||||||
ADV |
2.03 |
2.06 |
2.07 |
2.06 |
2.01 |
2.01 |
2.01 |
2.05 |
0.02 |
0.04 |
|
||||||||||
D |
0.98 |
0.98 |
0.95 |
0.94 |
0.92 |
0.92 |
0.92 |
0.91 |
-0.04 |
-0.01 |
|
||||||||||
F |
1.09 |
1.07 |
1.03 |
1.00 |
0.95 |
0.92 |
0.91 |
0.91 |
-0.10 |
-0.04 |
|
||||||||||
O |
1.88 |
1.92 |
1.92 |
1.87 |
1.78 |
1.74 |
1.69 |
1.69 |
0.00 |
-0.09 |
|
||||||||||
T |
2.25 |
2.23 |
2.22 |
2.20 |
2.18 |
2.18 |
2.16 |
2.17 |
-0.04 |
-0.01 |
CSA analysis of data obtained from investment fund managers and third-party data providers. Asset and expense data were obtained from Investor Economics.
Appendix -- Table 5.4.3 Asset Weighted Average Management Fees by Series Type, 2013-2020
Series Type |
2013 |
2014 |
2015 |
2016 |
2017 |
2018 |
2019 |
2020 |
Chg '13-'16 |
Chg '17-'20 |
|
||||||||||
A |
1.72 |
1.73 |
1.72 |
1.71 |
1.68 |
1.67 |
1.65 |
1.66 |
-0.01 |
-0.03 |
|
||||||||||
ADV |
1.66 |
1.73 |
1.74 |
1.71 |
1.67 |
1.68 |
1.67 |
1.71 |
0.05 |
0.03 |
|
||||||||||
D |
0.83 |
0.83 |
0.81 |
0.77 |
0.78 |
0.77 |
0.76 |
0.75 |
-0.06 |
-0.03 |
|
||||||||||
F |
0.82 |
0.82 |
0.79 |
0.77 |
0.73 |
0.72 |
0.72 |
0.72 |
-0.05 |
-0.01 |
|
||||||||||
O |
1.45 |
1.49 |
1.49 |
1.44 |
1.39 |
1.35 |
1.33 |
1.33 |
-0.01 |
-0.06 |
|
||||||||||
T |
1.82 |
1.82 |
1.81 |
1.80 |
1.78 |
1.77 |
1.77 |
1.76 |
-0.03 |
-0.02 |
CSA analysis of data obtained from investment fund managers and third-party data providers. Asset and expense data were obtained from Investor Economics.
Number of Fund Series by IFM Firm Type and Investing Strategy
IFM Firm Type |
A |
ADV |
D |
F |
O |
T |
Total |
|
|||||||
Association |
42 |
0 |
1 |
1 |
0 |
9 |
53 |
|
|||||||
Bank |
869 |
602 |
343 |
1,102 |
314 |
326 |
3,556 |
|
|||||||
Independent |
2,250 |
1 |
191 |
3,045 |
2,100 |
1,130 |
8,717 |
|
|||||||
Insurer |
316 |
0 |
1 |
547 |
224 |
203 |
1,291 |
|
|||||||
Total |
3,477 |
603 |
536 |
4,695 |
2,638 |
1,668 |
13,617 |
Appendix -- Table 5.5.2 Asset Weighted Average MERs by Product Type Product Type
Product Type |
2013 |
2014 |
2015 |
2016 |
2017 |
2018 |
2019 |
2020 |
Chg '13-'16 |
Chg '17-'20 |
|
||||||||||
3rd Party Fund-of-Funds |
1.89 |
1.87 |
1.81 |
1.76 |
1.65 |
1.62 |
1.58 |
1.56 |
-0.13 |
-0.10 |
|
||||||||||
Proprietary & 3rd Party Fund-of-Funds |
2.32 |
2.28 |
2.25 |
2.21 |
2.15 |
2.10 |
2.05 |
2.04 |
-0.11 |
-0.11 |
|
||||||||||
Proprietary Fund-of-Funds |
2.11 |
2.08 |
2.04 |
2.00 |
1.91 |
1.84 |
1.77 |
1.74 |
-0.12 |
-0.17 |
|
||||||||||
Stand-Alone Mutual Funds |
2.03 |
2.00 |
1.94 |
1.88 |
1.78 |
1.71 |
1.62 |
1.60 |
-0.15 |
-0.18 |
CSA analysis of data obtained from investment fund managers and third-party data providers. Asset and expense data were obtained from Investor Economics.
Appendix -- Table 5.5.3 Asset Weighted Average Management Fees by Product Type Product Type
Product Type |
2013 |
2014 |
2015 |
2016 |
2017 |
2018 |
2019 |
2020 |
Chg '13-'16 |
Chg '17-'20 |
|
||||||||||
3rd Party Fund-of-Funds |
1.63 |
1.91 |
1.68 |
1.81 |
1.45 |
1.42 |
1.38 |
1.37 |
0.17 |
-0.08 |
|
||||||||||
Proprietary & 3rd Party Fund-of-Funds |
1.89 |
1.86 |
1.84 |
1.79 |
1.73 |
1.67 |
1.64 |
1.63 |
-0.10 |
-0.10 |
|
||||||||||
Proprietary Fund-of-Funds |
1.73 |
1.71 |
1.68 |
1.63 |
1.57 |
1.51 |
1.46 |
1.42 |
-0.10 |
-0.15 |
|
||||||||||
Stand-Alone Mutual Funds |
1.61 |
1.60 |
1.56 |
1.50 |
1.43 |
1.37 |
1.32 |
1.30 |
-0.10 |
-0.13 |
CSA analysis of data obtained from investment fund managers and third-party data providers. Asset and expense data were obtained from Investor Economics.
Number of Fund Series by IFM Firm Type and Product Type
IFM Firm Type |
3rd Party Fund-of-Funds |
Proprietary & 3rd Party Fund-of-Funds |
Proprietary Fund-of-Funds |
Stand-Alone Mutual Funds |
Total |
|
|||||
Association |
0 |
6 |
0 |
47 |
53 |
|
|||||
Bank |
124 |
281 |
773 |
2,378 |
3,556 |
|
|||||
Independent |
39 |
288 |
1,628 |
6,762 |
8,717 |
|
|||||
Insurer |
33 |
145 |
137 |
976 |
1,291 |
|
|||||
Total |
196 |
720 |
2,538 |
10,163 |
13,617 |
Number of Fund Series by IFM Firm Type and Investing Strategy
IFM Firm Type |
Actively Managed Funds |
Passively Managed Funds |
Total |
|
|||
Association |
52 |
1 |
53 |
|
|||
Bank |
3,496 |
60 |
3,556 |
|
|||
Independent |
8,552 |
165 |
8,717 |
|
|||
Insurer |
1,291 |
0 |
1,291 |
|
|||
Total |
13,391 |
226 |
13,617 |
Number of ETFs by IFM Firm Type and Broad Asset Class
IFM Firm Type |
Balanced |
Equity |
Fixed Income |
Money Market |
Other |
Total |
|
||||||
Bank |
1 |
48 |
43 |
0 |
0 |
92 |
|
||||||
Independent |
8 |
192 |
81 |
2 |
1 |
284 |
|
||||||
Insurer |
0 |
10 |
3 |
0 |
0 |
13 |
|
||||||
Total |
9 |
250 |
127 |
2 |
1 |
389 |
Number of Fund Series by IFM Firm Type and Investing Strategy
IFM Firm Type |
Actively Managed Funds |
Passively Managed Funds |
Passive -- Strategic Beta |
Total |
|
||||
Bank |
27 |
47 |
18 |
92 |
|
||||
Independent |
85 |
118 |
81 |
284 |
|
||||
Insurer |
3 |
0 |
10 |
13 |
|
||||
Total |
115 |
165 |
109 |
389 |
{1} This report has benefited greatly from comments from internal and external peer reviewers. They include reviewers from The Investment Funds Institute of Canada (IFIC) and ISS MI Investor Economics. Any remaining errors of fact or interpretation are the sole responsibility of the authors.
{2} Our study is focused on MER and management fees because the MER is an ongoing cost levied annually, and the components of the MER are relatively consistent across asset classes for the same (mutual fund) series type.
{3} Russel Kinnel, "How expense ratios and star ratings predict success", Morningstar FundInvestor, August 2010, online: https://www.morningstar.com/articles/347327/how-expense-ratios-and-star-ratings-predict-success
{4} We analyze trends in segregated funds as part of our examination of whether product manufacturers and product distributors are shifting to products not subject to the CRM2 annual costs and performance reports requirements.
{5} Details of these fund characteristics, and the study's overall research design and fees methodology, can be found in Appendix A of the report.
{6} Since our mutual fund and ETF study samples do not include the entire universe of funds, this finding is only relevant for our study samples and should not be extrapolated to the larger mutual fund and ETF universe.
{7} Analysis in the body of the report focuses on fund characteristics that account for the majority of mutual fund and ETF assets.
{8} Not all series saw a decline in their asset shares during our study period. In general, the decline in asset share was seen in series with a wide range of MER/management fee rates. On average, asset shares of series with lower MER/management fee rates, however, grew more than asset shares of series with higher MER/management fee rates, and this contributed to lowering the asset-weighted average fees.
{9} Ibid.
{10} Strategic beta ETFs are funds that apply rules to a basket of securities (often represented by an index) to target companies that demonstrate specific "factors" such as value, momentum, or growth. Strategic beta ETFs are also known by other names such as smart beta or alternative beta. There is no universally accepted view as to whether strategic beta ETFs are passively managed investment funds or actively managed investment funds. For the purpose of our research, we have classified strategic beta ETFs as passively managed funds because they focus on a specific basket of securities often represented by indices.
{11} Redeemable investment funds generally allow investors to purchase or redeem securities of mutual funds on demand for a price representing a proportionate interest of the fund's net assets. Mutual funds are the main type of redeemable investment fund.
{12} Investor Economics Household Balanced Sheet Report, 2021.
{13} Ibid. Discretionary financial assets exclude assets held in defined benefit pension plans.
{14} The (Ontario) Securities Act, R.S.O. 1990, c. S.5 defines an investment fund to mean "a mutual fund or a non-redeemable investment fund" and National Instrument 41-101 defines an ETF to be a mutual fund.
{15} These dually registered/licensed advisers are most prevalent in financial advisory firms overseen by the Mutual Fund Dealer Association (MFDA) until December 31, 2022, and the Canadian Investment Regulatory Organization (CIRO) afterwards. As at 2018, 43% of advisers overseen by the MFDA were dually registered/licensed to sell insurance products, such as segregated funds, and mutual funds, and these advisers administered 21% of all mutual fund assets. See MFDA 2020 Client Research Report.
{16} Analysis excludes U.S. domiciled ETFs. In December 2019, Canadian investors held $38.8 billion in U.S. listed ETFs. Data source: Investor Economics ETF and Index Report, Q4 2019.
{17} The CSA's Mutual Fund Fees paper is available at: https://www.securities-administrators.ca/news/canadian-securities-regulators-publish-discussion-paper-on-mutual-fund-fees/
{18} Our analysis of fund-of-funds products found that 75% of them invest in proprietary stand-alone funds, i.e., funds that are sponsored by the same IFM.
{19} This product type is equivalent to a mutual fund fund-of-funds products. Common marketing names for these products are 'ETF portfolios' and 'asset-allocation ETFs'.
{20} Investor Economics Insights Report February 2021.
{21} See footnote 10 for a definition of strategic beta ETFs.
{22} The earliest available data are as of March 2014. CSA analysis of data obtained from Investor Economics ETF and Index Reports, Q1 2016, Q4 2019, Q4 2020.
{23} Ibid.
{24} Ibid.
{25} Net assets of long-term funds only, as at December 2020. Net assets for mutual funds include some ETF assets held in fund-of-fund products.
{26} Wealth Bar was acquired by CI Investments in 2019 and was re-branded as CI Direct Investing in 2020.
{27} CSA Staff Notice 31-342 Guidance for Portfolio Managers Regarding Online Advice. Available at https://www.osc.ca/sites/default/files/pdfs/irps/csa_20150924_31-342_portfolio-managers-online-advice.pdf
{28} This figure includes investment dealers or mutual fund dealers overseen by the Canadian Investment Regulatory Organization (formerly the MFDA and IIROC) in addition to portfolios managers directly overseen by provincial regulators.
{29} Internal OSC staff analysis.
{30} F-series were developed for fee-based accounts, and they do not include an embedded trailing commission.
{31} A series are the original/core series that have traditionally populated the mutual fund market, and they include an embedded trailing commission.
{32} Data from the Investment Fund Institute of Canada (IFIC).
{33} One of the research design objectives of this study was to have a study sample that was as similar as possible to the study sample used in the accompanying research report on investment fund performance (see Appendix A for details). To achieve this outcome, one of the fund selection criteria included in our research design was the requirement that mutual funds and ETFs must have at least 36 months of performance data. This fund selection criteria meant that mutual fund series introduced after 2017 were excluded from our analysis, and this exclusion helps explain why our study sample's share of industry assets and number of ETFs declined as our study period progressed (refer to Table 5.1.1).
{34} Unless otherwise noted, all references to asset-weighted fees from this point forward refer to both the asset-weighted average MER and asset-weighted average management fee.
{35} The fund asset weight effect would be positive for funds that saw an increase in their fund assets, for these two time periods.
{36} The sample size and population of series varied by fee type, fund characteristics, and time periods; therefore, any comparisons made would not be meaningfully equivalent.
{37} The interaction effect resulting from the addition or removal of a series will always be positive, all else equal, whereas changes in fees or asset shares for existing series can lead to either positive or negative interaction effects. See Appendix B for more details.
{38} Refer to Figure 1 in Appendix B for different ways changes in a series' asset share and fee affect the interaction effect and the aggregate asset-weighted fee.
{39} Our broad asset class categorization was developed and based on the Canadian Investment Funds Standards Committee (CIFSC) retail investment fund category definitions. The "other" category captures funds that do not fall into the other four categories, specifically balanced, equity, fixed income, or money market. Funds in the "other" asset class category invest in so called alternative/non-traditional assets such as real estate or derivatives products. The CIFSC methodology document used to inform our development of the broad asset class categories can be found at https://www.cifsc.org/wp- content/uploads/2019/05/CIFSC-2019-Category-Definitions.pdf.
{40} Funds categorized by CIFSC as "balanced funds" must invest between 5% and 90% of their non-cash assets in equity securities and between 10% and 95% of their non-cash assets in fixed-income securities. We did not have detailed portfolio holdings for balanced funds to re-categorize them as predominantly equity or fixed income funds.
{41} The asset-weighted average MERs and management fees for money market and other funds can be found in Appendix C.
{42} Mutual funds can sell series other than Series A and F. Advisor-series include series originally launched as no load products that have been modified to include trailer fee, and series manufactured by bank-affiliated IFMs and primarily sold through third-party advisers and full service brokerage rather than the bank's branch and discount networks. The A and Advisor series typically charge a full trailing commission. Series F are designed for fee-based accounts and they do not include an embedded trailing commission. Series D are designed for the discount brokerage channel and as at June 1, 2022, they can no longer include an embedded trailing commission. Series O are designed for high net worth accounts. In Series O, management fees are reduced compared to the original series of the fund and trailing commissions are negotiable between an investor and their adviser. Series T are designed for investors interested in a tax-efficient cash flow and charge an embedded trailing commission.
{43} In our analysis, series are classified by their main type and will include all sub-types. For example, F-series will includes F-HNW and F-T series.
{44} The asset-weighted average fees for the other series types -- advisor series, D-series, O-series and T-series can be found in Appendix C.
{45} A stand-alone mutual fund invests directly in securities such as stocks and bonds. Proprietary fund-of-funds are a type of mutual fund that invests in funds sponsored by the same IFM. Third party fund-of-funds are a type of mutual fund whereby the holdings are mutual funds managed by a third-party investment fund manager.
{46} Peer jurisdictions are those with a mature and sizeable investment fund market.
{47} PWL The Passive vs Active Fund Monitor Spring 2022. Available at https://www.pwlcapital.com/wp-content/uploads/2022/04/PWL-WP-May-Kerzerho-Passive-Active-Fund-Monitor-2022-1.pdf
{48} Bank-affiliated IFMs encompasses banks and credit unions.
{49} For example, F-series funds can have lower MERs than A-series funds because they do not include an embedded commission. However, this does not mean that investors pay less overall for F-series funds compared to an A-series as F-series funds are used by fee-based advisors who will charge an asset management fee on top of the fund cost.
{50} The three largest ETF providers in Canada do not pay for distribution. These three firms collectively manage 72% of ETF assets as at December 2020. Asset data from Investor Economics' ETF and Index Funds Report, Fourth Quarter 2020.
{51} In contrast, the investing objective of passively managed funds is to match the performance of the broad indices/benchmarks the funds are tracking.
{52} As noted, one of the research design objectives of this study was to have a study sample that was as similar as possible to the study sample for the performance study (see Appendix A for details). To achieve this outcome, one of the fund selection criteria included in our research design was the requirement that mutual funds and ETFs must have at least 36 months of performance data. This fund selection criteria meant that ETFs introduced after 2017 were excluded from our analysis, and this exclusion helps explain why our study sample's share of industry assets and number of ETFs declined as our study period progressed (refer to Table 6.2.1).
{53} Individual segregated funds
{54} This was a decline of 6%.
{55} Traditional passively managed ETFs are generally funds that track financial indices where the indices construction uses a market capitalization weighted methodology.
{56} See footnote 10 for a definition of strategic beta ETFs.
{57} Differences in underlying fund characteristics can include, for example, differences in fee structures, investment objectives, and risk preferences.
{58} Other is a category that encompasses funds that invest in alternative/non-traditional assets, such as real estate or derivatives instruments.
{59} See footnote 10 for a definition of strategic beta ETFs.
{60} Bank-affiliated IFMs include banks and credit unions.
{61} The mutual fund industry does not use a standardized approach in naming their fund series/class. We relied upon data provided by Investor Economics to standardize the fund series/class in our study sample. A-series are the original/core series that have traditionally populated the mutual fund market. Advisor series include series originally launched as no load products that have been modified to include trailer fee, and series manufactured by bank-affiliated IFMs and are primarily sold through third party advisers and full service brokerage rather than the bank's branch, discount. F-series are designed for fee-based accounts and they do not include an embedded trailing commission. D-series are designed for the discount brokerage channel and as at June 1, 2022, they can no longer include an embedded trailing commission that was typically between 25 and 50 basis points. O-series are designed for high net worth accounts. Management fees are reduced compared to the original series of the fund and trailing commissions are negotiable between an investor and their adviser. T-series are designed for investors interested in a tax-efficient cash flow. These funds charge an embedded trailing commission.
{62} Our sample population includes funds that were terminated or merged during our study period.
{63} We cross checked the value of outlier observations against information contained in regulatory documents and filings to confirm that the outliers were not reporting errors.
{64} Asset data for ETFs and mutual funds. The ETF asset data covered a time period of 2013-2020, and the mutual fund asset data was for 2020 only.
{65} We imposed this condition as we wanted the sample of funds in the fees analysis to be as similar as possible to the sample of funds in the performance analysis.
{66} MER after waiving or absorption of some of the MER costs by investment fund managers.
{67} Data on assets and fees from Investor Economics are based on the funds' final, audited Management Report of Fund Performance (MRFP) documents.
{68} Return data use the annualized average monthly gross total returns for a given calendar year.
{69} References to the aggregated asset-weighted average MER/management fee are always in reference to the metric for all fund series, unless otherwise noted.
{70} The fund asset weight effect calculation holds a series' MER or management fee constant to the start date of a given time period. For example, the fund asset weight analysis for the pre-implementation period, which is from 2013 to 2016, would hold the MER/management fee rates to the 2013 level.
{71} The fund asset weight effect includes the result of shifts in the distribution of assets across series from different fund categories and which may have different fees. For example, over a period of rising equity valuations, the share of total assets represented by equity series increases relative to other series, all else equal. In this example, the fund asset weight effect, and the aggregate asset-weighted average fee, would typically rise as fees in equity funds tend to be higher than those of other types of funds.
{72} The denominator used to calculate a fund series' overall fund asset weight was the assets of all series in our study sample where asset and expense data are available for both the start and end of the period (i.e. the series was not terminated or created within the period). The denominator for each fund characteristic changes according to the number of series with a given fund characteristic. For example, in 2020, the denominator used to calculate each series overall fund asset weight in the MER table was the sum of assets of 8,603 series, because this was the number of fund series in our study sample with asset and MER data available for 2017 and 2020. For equity mutual funds, in 2020, the denominator was the sum of assets of 4,353 series, as this was the number of equity mutual fund series in our study sample with asset and MER data available for 2017 and 2020.
{73} The price effect calculation holds a fund series' asset weight to its 2013 level, when we are examining the price effect for the pre-implementation period, and to its 2017 level when we are examining the price effect for the post-implementation period.
{74} These scenarios are exhaustive.
{75} The addition of new funds increases the asset weighted average MER/management fee because changes in the fund assets or MER/management fee calculations have a starting value of zero and end value greater than zero. As such, the change calculation will always yield a result that is greater than zero, i.e., positive.
{76} The top row of the tables in sections 5 and 6 of the report is labelled as "AW Avg MER Chg/Mgmt Fee Chg".
{*} Discussion of the impact assumes that the identified directional is the only change to any series in the sample (i.e. impact assumes 'all else equal').
{**} The impact of each effect on the overall aggregated asset-weighted average MERs/management fees depends on how the size and direction of each effect collectively net out.
{***} A change in the fund weight of a series has an offsetting impact on the fund weight of other series. E.g. If a series' fund weight falls then the fund weight of all other series must increase, all else equal. This is why a change in a series' fund weight can either increase or decrease the aggregate asset-weighted average MER/management fee depending on the size of the MER or management fee relative to other series in the sample. This is also why five scenarios are considered in Figure 1 for the fund weight effect. In contrast, the direction of the interaction effect on the aggregate asset-weighted average does not depend on the size of fees relative to other series in the sample, even if a series' fund weight changes. This is because the change in fees, which is the first term in the interaction effect, is zero for all other series in the sample under the assumption 'all else equal'.
Executive Summary |
3 |
|||
|
I. |
Purpose and Background of Research |
3 |
|
|
II. |
Research Findings |
4 |
|
|
|
i. |
2013 to 2020 Findings |
4 |
|
|
ii. |
Pre-implementation (2013-2016) and Post-implementation (2017-2020) Findings |
4 |
|
||||
1. |
Introduction |
5 |
||
|
||||
2. |
Overview of investment fund market in Canada, study samples, and study periods |
6 |
||
|
||||
3. |
Research Findings |
8 |
||
|
3.1 |
Mutual Fund Performance |
9 |
|
|
|
3.1.1 |
Overall Findings |
9 |
|
|
3.1.2 |
Mutual Fund Performance by Broad Asset Class |
11 |
|
|
3.1.3 |
Mutual Fund Performance by Product Type |
12 |
|
|
3.1.4 |
Mutual Performance by Investing Strategy |
13 |
|
|
3.1.5 |
Mutual Fund Performance by IFM Firm Type |
14 |
|
3.2 |
ETF Performance |
16 |
|
|
|
3.2.1 |
Overall Findings |
16 |
|
|
3.2.2 |
ETF Performance by Broad Asset Class |
18 |
|
|
3.2.3 |
ETF Performance by Investing Strategy |
19 |
|
|
3.2.4 |
ETF Performance by IFM Firm Type |
21 |
|
||||
4. |
Limitations of Research Findings |
22 |
||
|
||||
5. |
Conclusion |
23 |
||
|
||||
Appendix A -- Research Design |
24 |
|||
|
||||
Bibliography |
28 |
|||
The purpose of this research is to examine the post-implementation impacts on industry behaviour of the final phase of the Client Relationship Model (CRM2) amendments to National Instrument 31-103 Registration Requirements, Exemptions and Ongoing Registrant Obligations (herein after the CRM2 client statements, annual costs and performance reports).
The final amendments, which came into effect on July 15, 2016, were designed to ensure investors receive clear and complete disclosure of the performance of their investments and all fees associated with their accounts, including registrant compensation, on an annual basis.
This study examines whether greater transparency about transaction information and investment returns led to investment fund managers improving the risk-adjusted performance of their mutual funds and ETFs.{2}
The study period covers January 2013 to December 2020. This time period begins about 18 months before the first set of CRM2 amendments came into effect on July 15, 2014 (cost disclosures related to pre-trade disclosure of charges, and trade confirmation for debt securities). The 2013 start date gives us a baseline of what the investment fund industry looked like before the first set of CRM2 amendments were implemented. We hypothesize that the changes we are seeking to measure would take place several years after the CRM2 client statements, including transaction information, and performance reports are fully implemented. Considering this, the study timeline was extended to 2020 to account for this time lag, enabling us to more fully observe the extent of any changes.
Our analysis groups the research findings into three time periods, 2013 to 2020, which is the overall duration of our study period, the pre-implementation period of 2013 to 2016, and the post-implementation period of 2017 to 2020.
Finally, we note that the findings presented in this report are the views of CSA staff and are for informational purposes only. As such, statements made in the report do not represent the CSA's views of any official policy position.
Our research findings are based on a fund sample representing approximately 62% of mutual funds and ETFs in the Canadian market, as measured by assets under management (AUM) in December 2020.
We use total return and risk-adjusted return, also known as alpha, as measures of fund performance, and report results based on gross returns, i.e., returns before fees and expenses.{3} On balance, we find that the risk-adjusted performance relative to our model's benchmark for both mutual funds and ETFs, while remaining negative for the whole study period, improved in the years after the client statements, annual costs and performance reports were implemented.{4}
The annualized average gross total returns between 2013 and 2020, for our study sample, were 7.1% for mutual funds and 7.9% for ETFs. Accounting for fund risk, we found that the mean gross alphas relative to our model benchmarks were -3.5% for mutual funds and -2% for ETFs. These negative alphas imply that, on average, the total returns are lower than what would be implied by our benchmark model.
Comparing the performance findings for the pre- and post-implementation periods, we found that the risk-adjusted returns relative to our model benchmarks improved during the post-implementation period, even though they continued to remain negative. For mutual funds, the annualized average gross alpha was -5%, between 2013 and 2016, and -2.2% between 2017 to 2020. The ETF findings were -4.8% for the pre-implementation period and -0.6% for the post-implementation period.
Our research also analyzed whether there were differences in fund performance by the following fund characteristics: asset class, investing strategy, product type, and IFM type. The findings by fund characteristics directionally mirrored the overall findings but the annualized average gross total return and risk-adjusted return varied by fund characteristics.
There were no uniform directional trends for the gross total returns when we compared the pre- and post-implementation results. The returns increased for some fund characteristics and decreased for others, between these two time periods. The gross total returns ranged from 1% to 10.8% for mutuals funds, and 1.4% to 11.2% for ETFs.
Post-implementation evaluation is crucial in the policy development cycle because it allows regulators to understand whether newly introduced policy has been implemented as intended and is having the desired impacts and outcomes.
The purpose of this research is to examine the post-implementation impacts of the final phase of the Client Relationship Model (CRM2) amendments to National Instrument 31-103 Registration Requirements, Exemptions and Ongoing Registrant Obligations on industry behaviour (herein after the CRM2 client statements, annual costs and performance reports).
The final amendments, which came into effect on July 15, 2016, were designed to ensure investors receive clear and complete disclosure of the performance of their investments, client statements (covering account and security positions and transactions information) and all fees associated with their accounts, including registrant compensation, on an annual basis.{5}
The literature on disclosure regulation has identified numerous potential benefits of reporting standards including improved market liquidity, lower cost of capital, and more efficient portfolio choice among others.{6} Specifically, Zingales (2009) suggests that standardization in performance reporting makes comparison between funds easier and hence facilitates capital allocation toward more talented managers. Hence, it can be argued that providing standardized performance reports would motivate investors to compare investment funds and avoid those with poor performance. Moreover, CRM2 compliant reporting would allow fund managers to signal their product quality more effectively, reducing the cost of information asymmetry.{7} The resulting shift in investor demand toward outperforming funds should prompt fund managers to raise the performance of their offerings (e.g., perhaps by hiring more skilled portfolio managers and phasing out underperforming funds). This would ultimately improve the performance of the investment fund market as a whole. Therefore, we hypothesize that the enhanced transparency and standards of performance reporting brought about by the CRM2 amendments will lead to improvements in investment fund performance.
This study focuses on the impacts of the CRM2 implementation on investment fund performance. A separate research report entitled A Post-Implementation Review of the Impacts of the CRM2 Annual Costs and Performance Reports on Investment Fund Fees examines the impacts of the new regulations on mutual fund and ETF MERs and management fees.
Our research findings are organized as follows in the report:
• section 2 provides an overview of the investment fund market in Canada, our study samples, and study periods,
• section 3 presents the performance results for mutual funds and ETFs,
• section 4 discusses the limitations of our research findings, and
• section 5 presents our conclusion.
Canadian households, in 2013, held $4.1 trillion in discretionary financial assets{8} (refer to Table 1). Of this amount, approximately $1.0 trillion (26%) were held in investment funds.{9} By the end of 2020, household discretionary financial assets increased to $6.5 trillion, and of this amount, about $2.0 trillion (30%) dollars were held in investment funds.
Table 1, below, further breaks down these figures by investment fund type. Within investment funds, assets are concentrated in mutual funds, but ETFs assets are growing and gaining market share at the expense of mutual funds.
Table 1 Estimated Canadian Discretionary Financial Assets Held in Investment Funds
|
Asset Size ($B) |
Share of Investment Funds (%) |
Share of discretionary financial assets (%) |
|||
|
||||||
|
2013 |
2020 |
2013 |
2020 |
2013 |
2020 |
|
||||||
All discretionary financial assets |
4091 |
6517 |
|
|
|
|
|
||||||
Investment Funds |
1044 |
1947 |
|
|
26 |
30 |
|
||||||
Canadian listed ETFs |
63 |
257 |
6 |
13 |
2 |
4 |
|
||||||
Mutual Funds excl ETFs |
981 |
1690 |
94 |
87 |
24 |
26 |
Source: CSA estimates based on data in Investor Economics Household Balance Sheet Report, 2014, 2016 and 2021; excludes seg funds; closed-end funds and alternatives
Graphs 1 and 2, below, show the number of mutual funds and ETFs, and their assets as measured by assets under management (AUM), for each year of our study period.
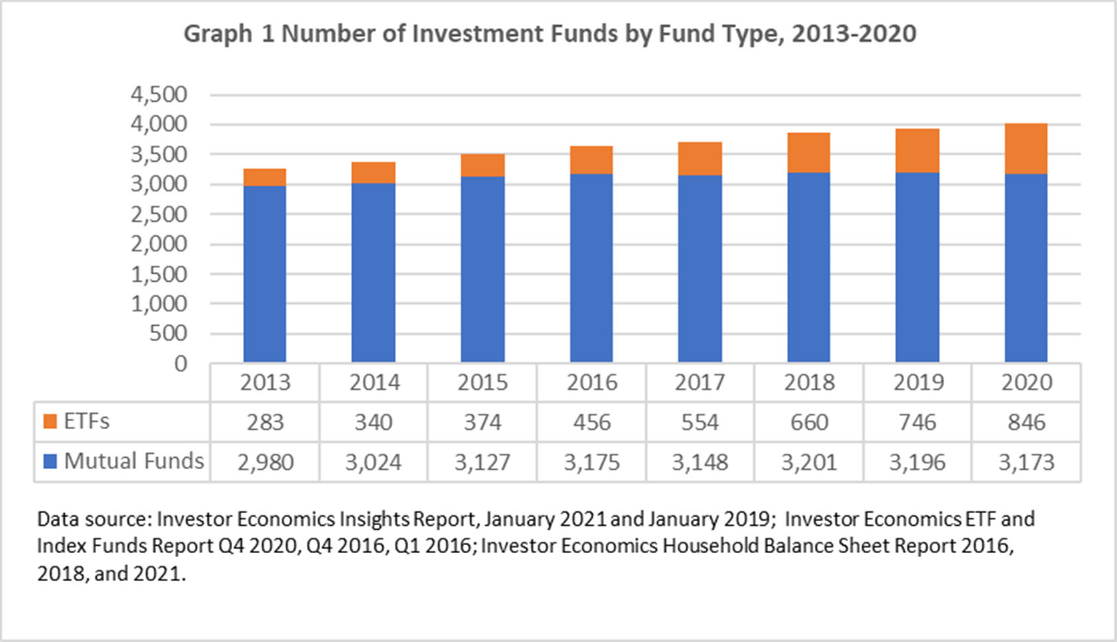
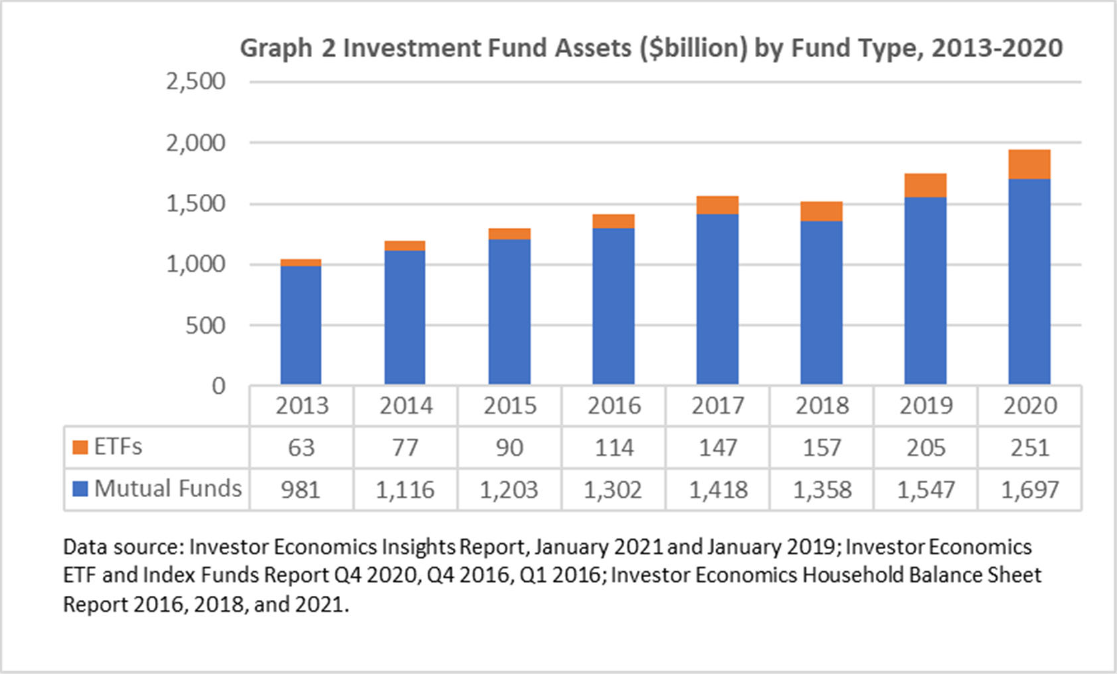
Our study sample includes 3,086 unique mutual funds and 299 ETFs. The number of mutual funds increased from 1,974 in 2013 to 2,106 in 2020. The total AUM of mutual funds rose from $594 billion, in 2013, to $995 billion by the end of 2020. Both the number of ETFs in our study sample and their total AUM more than tripled during our study period. The number of ETFs increased from 83, in 2013, to 284 in 2020, while the total AUM increased from $46.6 billion to $162 billion for the same time period.
Taken together, the aggregate AUM of our ETF and mutual fund study samples was almost $1.2 trillion by the end of 2020, and these funds represented approximately 62% of the total AUM of the Canadian mutual fund and ETF markets.{10}
We present our performance results for mutual funds and ETFs in the subsections below, for all three time periods, and by fund characteristics.{11}
For the entire study period, i.e., 2013-2020, our mutual fund sample contained 3,086 unique mutual funds, with an average age of 12 years, and an average AUM of $361.2 million.{12} The total AUM of our mutual fund study sample, in December 2020, was $995.5 billion, and this represents 59% of the Canadian mutual fund market total net assets.{13}
Both the equal-weighted and asset-weighted average total returns before fees were 0.59% per month{14}, between 2013 and 2020. This finding suggests that there was no difference in total returns by fund size.
Our estimates of the monthly equal weighted and asset weighted average gross alphas{15}, from 2013 to 2020, were -0.37% and -0.29%, respectively. These negative alpha values indicate that, on average, mutual fund total returns are lower than the returns implied by the funds' exposures to the risk factors of our model. Negative risk-adjusted performance relative to the Fama and French model is not uncommon and has been documented in several studies of the U.S. mutual fund market. Researchers including Gil-Bazo and Verdue (2009), Fama and French (2010) among others have found that it is formidable for asset managers to generate returns higher than those implied by the Fama and French model. The asset weighted average gross alpha is slightly higher than the equal weighted alpha. This finding suggests that fund size appears to have a positive impact on risk-adjusted performance, despite having no effect on total returns.
The pre- and post-implementation period results show that, between these two time periods, total returns decreased by 0.13 percentage points for the equal weighted average and by 0.04 percentage points for the asset weighted average (refer to rows 2 and 3 in Panel A, Table 2). For the same two time periods, the risk-adjusted performance increased by 0.27 percentage points for the equal weighted average gross alpha, and 0.24 percentage points for the asset weighted average gross alpha.
Panel B of Table 2 presents the total returns and gross alphas for each year of our study period. The number of mutual funds, in our study sample, slowly increased from 1,974 in 2013 to 2,106 in 2020.{16} There was growth in both the average fund AUM and total AUM throughout our study period. The sole exception was in 2018, when the total AUM dropped but the average fund AUM continued to grow.{17} The total return figure fluctuated year-over-year and was negative in 2018. In contrast, the risk-adjusted performance steadily improved, starting in 2014.
Table 2. Summary of MF Monthly Gross Performance
Panel A. Performance over the Sample Period |
|||||||||
|
|||||||||
|
|
|
Total Return (%/month) |
Gross Alpha (%/month) |
|
|
|
||
|
|||||||||
Period |
No. of Obs. (Fund x Month) |
No. of Funds |
EW Mean |
AW Mean |
EW Mean |
AW Mean |
Average Age |
Average AUM ($ million) |
Total AUM ($ billion) |
|
|||||||||
2013-2020 |
201,416 |
3,086 |
0.59 |
0.59 |
-0.37 |
-0.29 |
11.95 |
361.15 |
995.46 |
|
|||||||||
2013-2016 |
95,571 |
2,567 |
0.66 |
0.62 |
-0.51 |
-0.42 |
11.49 |
331.17 |
780.01 |
|
|||||||||
2017-2020 |
105,845 |
2,704 |
0.53 |
0.58 |
-0.24 |
-0.18 |
12.37 |
388.22 |
995.46 |
Panel B. Performance by Year |
|||||||||
|
|||||||||
|
|
|
Total Return (%/month) |
Gross Alpha (%/month) |
|
|
|
||
|
|||||||||
Period |
No. of Obs. (Fund x Month) |
No. of Funds |
EW Mean |
AW Mean |
EW Mean |
AW Mean |
Average Age |
Average AUM ($ million) |
Total AUM ($ billion) |
|
|||||||||
2013 |
22,029 |
1,974 |
1.23 |
1.02 |
-0.51 |
-0.41 |
11.29 |
309.38 |
594.13 |
|
|||||||||
2014 |
23,132 |
2,081 |
0.61 |
0.68 |
-0.61 |
-0.53 |
11.53 |
330.48 |
664.47 |
|
|||||||||
2015 |
24,864 |
2,198 |
0.31 |
0.25 |
-0.47 |
-0.39 |
11.52 |
336.67 |
707.64 |
|
|||||||||
2016 |
25,546 |
2,316 |
0.57 |
0.6 |
-0.45 |
-0.37 |
11.6 |
345.23 |
780.01 |
|
|||||||||
2017 |
26,582 |
2,334 |
0.66 |
0.59 |
-0.37 |
-0.31 |
11.8 |
368.88 |
841.31 |
|
|||||||||
2018 |
27,009 |
2,362 |
-0.4 |
-0.29 |
-0.24 |
-0.2 |
12.16 |
372.76 |
789.95 |
|
|||||||||
2019 |
27,418 |
2,432 |
1.1 |
1.08 |
-0.2 |
-0.14 |
12.42 |
379.34 |
920.63 |
|
|||||||||
2020 |
24,836 |
2,106 |
0.78 |
0.89 |
-0.12 |
-0.08 |
13.13 |
435.54 |
995.46 |
Table 3 presents the mutual fund performance results by the funds' broad asset class: balanced, equity, fixed income and money market. Our sample consists of 980 balanced funds, 1,610 equity funds, 436 fixed income funds, and 100 money market funds. Balanced funds, with an average age of 10.1 years are the youngest of the four asset classes, yet they have the largest total and average fund AUM for the entire study period. The average fund AUM in December 2020 was $666.1 million and the total AUM was $558.1 billion. Equity mutual funds have the second largest total AUM, followed by fixed income funds. Funds belonging to both these asset classes have an average age that is between 12 to 13 years. Money market funds, with an average age of 17.9 years, are the oldest funds in our study sample, and yet they have the smallest total and average fund AUMs, of the four asset classes.
Balanced and equity funds have the highest monthly asset weighted average total returns of 0.51% and 0.86%, respectively. These funds, however, have the lowest monthly asset weighted average risk-adjusted performance, of -0.3% for balanced funds and -0.32% for equity funds. Fixed income and money market funds have the highest monthly asset weighted risk-adjusted performance, with gross alphas of -0.11% and -0.24%, respectively.
Comparing the asset weighted risk-adjusted performance for each asset class, for the pre- and post-implementation periods, we find that there is a consistent improvement in performance -- between 0.2 and 0.3 percentage points per month. Except for fixed income funds, total returns decreased for most asset classes, between these two time periods.
Table 3. Summary of MF Monthly Gross Performance by Asset Class
|
|
|
|
Total Return (%/month) |
Gross Alpha (%/month) |
|
|
|
||
|
||||||||||
Asset Class |
Period |
No. of Obs. (Fund x Month) |
No. of Funds |
EW Mean |
AW Mean |
EW Mean |
AW Mean |
Average Age |
Average AUM ($ million) |
Total AUM ($ billion) |
|
||||||||||
Balanced |
2013-2020 |
61,549 |
980 |
0.49 |
0.51 |
-0.34 |
-0.3 |
10.09 |
666.11 |
558.1 |
|
||||||||||
Balanced |
2013-2016 |
28,620 |
791 |
0.54 |
0.53 |
-0.46 |
-0.42 |
9.45 |
607.65 |
453.19 |
|
||||||||||
Balanced |
2017-2020 |
32,929 |
863 |
0.45 |
0.49 |
-0.23 |
-0.21 |
10.66 |
716.92 |
558.1 |
|
||||||||||
Equity |
2013-2020 |
106,021 |
1,610 |
0.77 |
0.86 |
-0.43 |
-0.32 |
12.61 |
220.49 |
312.62 |
|
||||||||||
Equity |
2013-2016 |
51,352 |
1,360 |
0.88 |
0.9 |
-0.59 |
-0.49 |
12.08 |
206.05 |
244.32 |
|
||||||||||
Equity |
2017-2020 |
54,669 |
1,382 |
0.68 |
0.83 |
-0.28 |
-0.19 |
13.11 |
234.06 |
312.62 |
|
||||||||||
Fixed Income |
2013-2020 |
26,373 |
436 |
0.25 |
0.3 |
-0.19 |
-0.11 |
11.93 |
266.88 |
109.06 |
|
||||||||||
Fixed Income |
2013-2016 |
11,566 |
344 |
0.2 |
0.23 |
-0.3 |
-0.24 |
12.1 |
258.34 |
70.75 |
|
||||||||||
Fixed Income |
2017-2020 |
14,807 |
384 |
0.29 |
0.36 |
-0.11 |
-0.02 |
11.79 |
273.55 |
109.06 |
|
||||||||||
Money Market |
2013-2020 |
7,473 |
100 |
0.09 |
0.11 |
-0.26 |
-0.24 |
17.91 |
177.71 |
15.68 |
|
||||||||||
Money Market |
2013-2016 |
4,033 |
98 |
0.13 |
0.13 |
-0.37 |
-0.38 |
16.73 |
171.2 |
11.75 |
|
||||||||||
Money Market |
2017-2020 |
3,440 |
86 |
0.04 |
0.08 |
-0.12 |
-0.09 |
19.3 |
185.35 |
15.68 |
The mutual funds in our sample comprise of four product types: stand-alone funds, proprietary fund-of-funds (proprietary FoF), proprietary & 3rd party fund-of-funds (proprietary and 3rd party FoF), and 3rd party fund-of-funds (3rd party FoF).
Stand-alone funds account for most mutual funds in our study sample, both in terms of the number of funds (77.6%) and the total AUM (59.9%), at the end of 2020. Stand-alone funds were also the oldest product type, with an average age of 12.7 years.
The three types of FoFs account for 25.1% of funds and 40.1% of total AUM. The age of these funds is about 3 years less than stand-alone funds, on average.{18}
Table 4, below, summarizes mutual fund performance by product type. Stand-alone funds have the highest average total returns and are among the funds with the highest risk-adjusted returns, second only to 3rd party FoF. All three FoFs have very similar total returns, which are between 0.51% and 0.55% per month. Risk-adjusted performance is, however, more varied, with third-party FoF having the best gross alpha, -0.23% per month.
Comparing the pre- and post-implementation period findings, we observe that all product types gained between 0.2 and 0.3 percentage points per month in risk-adjusted performance. Changes in total returns, by product type, varied after the CRM2 requirements were fully implemented.
Table 4. Summary of MF Monthly Gross Performance by Product Type
|
|
|
|
Total Return (%/month) |
Gross Alpha (%/month) |
|
|
|
||
|
||||||||||
Product Type |
Period |
No. of Obs. (Fund x Month) |
No. of Funds |
EW Mean |
AW Mean |
EW Mean |
AW Mean |
Average Age |
Average AUM ($ million) |
Total AUM ($ billion) |
|
||||||||||
Stand-alone Fund |
2013-2020 |
156,840 |
2,396 |
0.61 |
0.64 |
-0.37 |
-0.28 |
12.66 |
294.58 |
596.06 |
|
||||||||||
Stand-alone Fund |
2013-2016 |
74,866 |
2,005 |
0.68 |
0.67 |
-0.52 |
-0.42 |
12.25 |
284.09 |
485.43 |
|
||||||||||
Stand-alone Fund |
2017-2020 |
81,974 |
2,085 |
0.55 |
0.62 |
-0.23 |
-0.15 |
13.04 |
304.16 |
596.06 |
|
||||||||||
Proprietary FoF |
2013-2020 |
33,374 |
563 |
0.53 |
0.51 |
-0.37 |
-0.3 |
9.55 |
644.51 |
341.92 |
|
||||||||||
Proprietary FoF |
2013-2016 |
15,859 |
425 |
0.59 |
0.5 |
-0.48 |
-0.43 |
8.69 |
521.39 |
238.59 |
|
||||||||||
Proprietary FoF |
2017-2020 |
17,515 |
508 |
0.48 |
0.51 |
-0.26 |
-0.22 |
10.32 |
755.99 |
341.92 |
|
||||||||||
Proprietary & 3rd Party FoF |
2013-2020 |
8,053 |
149 |
0.53 |
0.52 |
-0.36 |
-0.33 |
9.21 |
499.93 |
48.53 |
|
||||||||||
Proprietary & 3rd Party FoF |
2013-2016 |
3,590 |
102 |
0.61 |
0.56 |
-0.49 |
-0.46 |
8.99 |
459.76 |
44.49 |
|
||||||||||
Proprietary & 3rd Party FoF |
2017-2020 |
4,463 |
137 |
0.47 |
0.5 |
-0.25 |
-0.24 |
9.39 |
532.25 |
48.53 |
|
||||||||||
3rd Party FoF |
2013-2020 |
3,033 |
62 |
0.63 |
0.55 |
-0.29 |
-0.23 |
8.93 |
326.8 |
8.7 |
|
||||||||||
3rd Party FoF |
2013-2016 |
1,188 |
31 |
0.66 |
0.57 |
-0.45 |
-0.34 |
8.61 |
383.63 |
11.39 |
|
||||||||||
3rd Party FoF |
2017-2020 |
1,845 |
61 |
0.61 |
0.54 |
-0.19 |
-0.14 |
9.14 |
290.2 |
8.7 |
Table 5, below, summarizes mutual fund performance by a fund's investing strategy. Ninety-seven percent of mutual funds (3,001 out of 3,086 funds) in our study sample use an actively managed strategy. Actively managed funds account for 98% of the total AUM at the end of 2020. Passively managed funds compared to actively managed funds account for less than 3% of the number of funds, and less than 2% of total AUM, despite having the same average age of approximately 12 years.
Actively managed funds, in comparison to passively managed funds, have lower monthly asset weighted average total returns (0.59% vs. 0.85%), yet their risk-adjusted performance is only marginally lower (-0.29% vs. -0.24%).
Both actively managed and passively managed funds improved their risk-adjusted performance during the post-implementation period (0.2 and 0.3 percentage points, respectively). Total returns, however, fell for actively managed funds and rose for passively managed funds.
Table 5. Summary of MF Monthly Gross Performance by Investing Strategy
|
|
|
|
Total Return (%/month) |
Gross Alpha (%/month) |
|
|
|
||
|
||||||||||
Strategy |
Period |
No. of Obs. (Fund x Month) |
No. of Funds |
EW Mean |
AW Mean |
EW Mean |
AW Mean |
Average Age |
Average AUM ($ million) |
Total AUM ($ billion) |
|
||||||||||
Active |
2013-2020 |
195,879 |
3,001 |
0.59 |
0.59 |
-0.37 |
-0.29 |
11.95 |
365.1 |
973.31 |
|
||||||||||
Active |
2013-2016 |
92,892 |
2,493 |
0.66 |
0.61 |
-0.51 |
-0.42 |
11.51 |
335.88 |
768.1 |
|
||||||||||
Active |
2017-2020 |
102,987 |
2,639 |
0.53 |
0.57 |
-0.24 |
-0.18 |
12.35 |
391.46 |
973.31 |
|
||||||||||
Passive |
2013-2020 |
5,421 |
88 |
0.73 |
0.85 |
-0.35 |
-0.24 |
11.98 |
223.74 |
21.9 |
|
||||||||||
Passive |
2013-2016 |
2,611 |
76 |
0.73 |
0.79 |
-0.52 |
-0.41 |
10.78 |
169.61 |
11.8 |
|
||||||||||
Passive |
2017-2020 |
2,810 |
65 |
0.73 |
0.89 |
-0.19 |
-0.14 |
13.09 |
274.04 |
21.9 |
Mutual funds sponsored by bank-affiliated IFMs and independent IFMs account for 70.5% of funds (2,175 funds) and 86.3% of total AUM ($859.4 billion) at the end of 2020. These funds had an average age of about 12 years. There are 281 funds sponsored by insurer-affiliated IFMs. These funds are the youngest funds, with an average age of 9 years, and a total AUM of $59 billion, at the end of 2020. The oldest funds are those sponsored by IFMs that are professional associations. These 24 funds have a total AUM of $2.4 billion at the end of 2020.
The asset weighted average total returns and gross alphas for the entire study period, and by IFM firm type, range from 0.5% to 0.62% and from -0.39% to -0.19% per month, respectively.
We observe that there appeared to be differences in the average risk-adjusted performance among IFM types. However, caution should be taken to interpret this result. First, it is worth noting that the differences were not statistically significant.{19} Second, these are differences in the sample mean only and do not account for the difference in the distribution of mutual funds (for example, across asset class or product type) sponsored by each IFM type, which is important when making meaningful comparisons of each group's performance. Finally, as emphasized in Section 4 below, this result may depend on the measure of performance and our specific sample of mutual funds. There is no guarantee that it will hold for a different measure of performance and/or for a different sample of mutual funds.
Comparing the results for the pre- and post-implementation periods, we find that the risk-adjusted performance improved between 0.2 to 0.3 percentage points per month during the post-implementation period. Total returns, meanwhile, showed little improvement and in some instances declined after the CRM2 requirements were fully implemented.
Table 6. Summary of MF Monthly Gross Performance by IFM Firm Type
|
|
|
|
Total Return (%/month) |
Gross Alpha (%/month) |
|
|
|
||
|
||||||||||
Firm Type |
Period |
No. of Obs. (Fund x Month) |
No. of Funds |
EW Mean |
AW Mean |
EW Mean |
AW Mean |
Average Age |
Average AUM ($ million) |
Total AUM ($ billion) |
|
||||||||||
Association |
2013-2020 |
1,866 |
24 |
0.56 |
0.5 |
-0.38 |
-0.39 |
19.77 |
145.48 |
2.42 |
|
||||||||||
Association |
2013-2016 |
1,039 |
24 |
0.6 |
0.49 |
-0.51 |
-0.53 |
16.72 |
134.13 |
3.45 |
|
||||||||||
Association |
2017-2020 |
827 |
24 |
0.51 |
0.51 |
-0.21 |
-0.24 |
23.6 |
159.73 |
2.42 |
|
||||||||||
Bank |
2013-2020 |
68,766 |
992 |
0.64 |
0.57 |
-0.32 |
-0.27 |
12.57 |
526.9 |
536.46 |
|
||||||||||
Bank |
2013-2016 |
30,907 |
780 |
0.69 |
0.56 |
-0.48 |
-0.41 |
12.24 |
484.08 |
381.13 |
|
||||||||||
Bank |
2017-2020 |
37,859 |
940 |
0.6 |
0.58 |
-0.2 |
-0.17 |
12.84 |
561.87 |
536.46 |
|
||||||||||
Independent |
2013-2020 |
81,263 |
1,183 |
0.6 |
0.62 |
-0.39 |
-0.33 |
12.21 |
338.99 |
322.89 |
|
||||||||||
Independent |
2013-2016 |
39,542 |
997 |
0.7 |
0.67 |
-0.52 |
-0.45 |
11.78 |
336.01 |
307.65 |
|
||||||||||
Independent |
2017-2020 |
41,721 |
1,077 |
0.51 |
0.57 |
-0.26 |
-0.21 |
12.63 |
341.81 |
322.89 |
|
||||||||||
Insurer |
2013-2020 |
16,463 |
281 |
0.59 |
0.61 |
-0.33 |
-0.19 |
9.02 |
185.18 |
59 |
|
||||||||||
Insurer |
2013-2016 |
7,253 |
228 |
0.6 |
0.55 |
-0.45 |
-0.34 |
8.82 |
132.38 |
31.24 |
|
||||||||||
Insurer |
2017-2020 |
9,210 |
248 |
0.58 |
0.64 |
-0.22 |
-0.12 |
9.17 |
226.76 |
59 |
This section of the report examines changes in ETF performance during our study period. We will examine ETF performance for the following three fund characteristics: broad asset class, investing strategy, and IFM firm type.
Overall, the performance of ETFs was similar to that of mutual funds. Total returns fluctuated while gross alphas consistently improved starting in 2014, and became positive starting in 2019, although the size of the improvement is negligible. The gross alphas for ETFs are also higher than the gross alphas for mutual funds during our study period.
Table 7 summarises ETF performance for our study period. Panel A presents the performance results for three time periods -- the overall study period, and the pre-and post-implementation periods.
Panel B of Table 7 provides the ETF performance for each year of our study period. The number of ETFs and total AUM have both more than tripled during our study period. In comparison to our mutual fund sample, the average fund size for ETFs has fluctuated and declined during our study period{20}, perhaps due to a more dynamic market structure.
Our ETF sample, for the entire study period, consists of 293 funds, with an average age of 7.2 years, and an average fund AUM of $509.4 million. The total AUM of our ETF sample is $162 billion at the end of 2020, and our study sample accounts for 65% of the Canadian ETF market total net assets.{21}
The equal weighted and asset weighted average gross total returns are 0.61% and 0.66% per month, respectively. Our estimates of the monthly equal weighted and asset weighted average gross alpha are -0.19% and -0.17%, respectively. The asset weighted averages are slightly higher than the equal weighted averages. This finding suggests that ETF fund size has a positive impact on both total returns and risk-adjusted returns.
Comparing the pre and post-implementation periods shows that ETF total returns and risk-adjusted performance both increased significantly. Total returns and risk-adjusted performance increased by 0.05 and 0.35 percentage points, respectively in equal weighted average, and by 0.14 and 0.35 percentage points, respectively in asset weighted average.
Table 7. Summary of ETF Monthly Gross Performance
Panel A. Performance over the Sample Period |
|||||||||
|
|||||||||
|
|
|
Total Return (%/month) |
Gross Alpha (%/month) |
|
|
|
||
|
|||||||||
Period |
No. of Obs. (Fund x Month) |
No. of Funds |
EW Mean |
AW Mean |
EW Mean |
AW Mean |
Average Age |
Average AUM ($ million) |
Total AUM ($ billion) |
|
|||||||||
2013-2020 |
16783 |
293 |
0.61 |
0.66 |
-0.19 |
-0.17 |
7.18 |
509.44 |
161.99 |
|
|||||||||
2013-2016 |
5777 |
176 |
0.58 |
0.57 |
-0.42 |
-0.4 |
6.18 |
489.14 |
89.1 |
|
|||||||||
2017-2020 |
11006 |
293 |
0.63 |
0.71 |
-0.07 |
-0.05 |
7.7 |
520.12 |
161.99 |
Panel B. Performance by Year |
|||||||||
|
|||||||||
|
|
|
Total Return (%/month) |
Gross Alpha (%/month) |
|
|
|
||
|
|||||||||
Period |
No. of Obs. (Fund x Month) |
No. of Funds |
EW Mean |
AW Mean |
EW Mean |
AW Mean |
Average Age |
Average AUM ($ million) |
Total AUM ($ billion) |
|
|||||||||
2013 |
899 |
83 |
0.63 |
0.62 |
-0.47 |
-0.33 |
5.93 |
584.13 |
46.55 |
|
|||||||||
2014 |
1228 |
122 |
0.73 |
0.71 |
-0.56 |
-0.56 |
5.99 |
498.81 |
56.6 |
|
|||||||||
2015 |
1654 |
150 |
-0.11 |
-0.17 |
-0.42 |
-0.42 |
6.1 |
443.33 |
65.46 |
|
|||||||||
2016 |
1996 |
176 |
1.04 |
1.02 |
-0.31 |
-0.32 |
6.48 |
478.06 |
89.1 |
|
|||||||||
2017 |
2268 |
189 |
0.82 |
0.7 |
-0.21 |
-0.24 |
7.01 |
520.52 |
103.76 |
|
|||||||||
2018 |
2531 |
211 |
-0.4 |
-0.27 |
-0.07 |
-0.08 |
7.54 |
515.5 |
106.82 |
|
|||||||||
2019 |
2852 |
243 |
1.27 |
1.24 |
-0.02 |
0.01 |
7.97 |
527.31 |
136.39 |
|
|||||||||
2020 |
3355 |
284 |
0.74 |
0.98 |
-0.01 |
0.03 |
8.07 |
517.23 |
161.99 |
The ETF performance findings by asset class are presented in Table 8, below. Our ETF sample is comprised of 10 balanced funds, 190 equity funds, 94 fixed income funds, and 2 money market funds. Balanced ETFs are the oldest, with an average age of 8.2 years, yet they have the smallest total AUM ($2.7 billion at the end of 2020). Equity and fixed income ETFs are the largest asset classes in terms of number of funds (190 and 94, respectively) and total AUM at the end of 2020 ($100.9 billion and $55.7 billion, respectively). Money market ETFs is the smallest asset class, within our study sample, with only 2 funds and a total AUM of $2.8 billion at the end of 2020.{22}
Equity and balanced ETFs have the highest asset weighted average total returns during our study period (0.88% and 0.55%, respectively), yet their risk-adjusted performance, of -0.18%, is the lowest of the four asset classes. In contrast, fixed income and money market ETFs have the highest risk-adjusted performance, in spite of their lower total returns.
Comparing the equal weighted and asset weighted averages of the two largest asset classes of funds, i.e., equity and fixed income ETFs, we find that the impact of fund size on performance is not clear. Fund size has a positive effect on performance for equity ETFs, but a negative effect for fixed income ETFs.
We find that there is consistent improvement in both the total returns and risk-adjusted performance across all asset classes, in the post-implementation period, and the improvements in general were larger for the risk-adjusted performance. The lower overall risk-adjusted performance for balanced and equity ETF is mainly due to their poorer pre-implementation performance.
Table 8. Summary of ETF Monthly Gross Performance by Asset Class
|
|
|
|
Total Return (%/month) |
Gross Alpha (%/month) |
|
|
|
||
|
||||||||||
Asset Class |
Period |
No. of Obs. (Fund x Month) |
No. of Funds |
EW Mean |
AW Mean |
EW Mean |
AW Mean |
Average Age |
Average AUM ($ million) |
Total AUM ($ billion) |
|
||||||||||
Balanced |
2013-2020 |
535 |
10 |
0.52 |
0.55 |
-0.27 |
-0.18 |
8.15 |
249.77 |
2.66 |
|
||||||||||
Balanced |
2013-2016 |
261 |
6 |
0.48 |
0.44 |
-0.45 |
-0.41 |
6.52 |
213.93 |
1.23 |
|
||||||||||
Balanced |
2017-2020 |
274 |
9 |
0.57 |
0.64 |
-0.09 |
-0.01 |
9.69 |
283.91 |
2.66 |
|
||||||||||
Equity |
2013-2020 |
10759 |
190 |
0.78 |
0.88 |
-0.22 |
-0.18 |
7.28 |
480.37 |
100.87 |
|
||||||||||
Equity |
2013-2016 |
3598 |
116 |
0.78 |
0.8 |
-0.5 |
-0.47 |
6.4 |
477.15 |
54 |
|
||||||||||
Equity |
2017-2020 |
7161 |
188 |
0.78 |
0.93 |
-0.07 |
-0.03 |
7.72 |
481.98 |
100.87 |
|
||||||||||
Fixed Income |
2013-2020 |
5342 |
94 |
0.31 |
0.32 |
-0.13 |
-0.16 |
6.88 |
592.91 |
55.71 |
|
||||||||||
Fixed Income |
2013-2016 |
1867 |
54 |
0.23 |
0.2 |
-0.25 |
-0.28 |
5.7 |
561.2 |
33.4 |
|
||||||||||
Fixed Income |
2017-2020 |
3475 |
94 |
0.35 |
0.37 |
-0.06 |
-0.09 |
7.51 |
610.3 |
55.71 |
|
||||||||||
Money Market |
2013-2020 |
147 |
2 |
0.09 |
0.11 |
-0.21 |
-0.07 |
7.59 |
577.54 |
2.75 |
|
||||||||||
Money Market |
2013-2016 |
51 |
2 |
0.05 |
0.06 |
-0.41 |
-0.39 |
6.68 |
97.75 |
0.48 |
|
||||||||||
Money Market |
2017-2020 |
96 |
2 |
0.1 |
0.12 |
-0.1 |
-0.05 |
8.08 |
832.42 |
2.75 |
The ETFs in our study sample employ an actively managed, passively managed, or strategic beta{23} investing strategy.
The distribution of ETFs by investing strategy is dominated by passively managed and strategic beta funds, whereas for mutual funds active fund management is the dominant investing strategy. Funds employing these two investing strategies account for 72% of funds and 85% of total AUM, of our ETF sample at the end of 2020.
Passively managed and strategic beta ETFs are, on average, older than actively managed ETFs (8.1 year, 6.5 years, and 5.6 years respectively).
Strategic beta ETFs have the highest asset weighted average total returns (0.75%), followed by passively managed ETFs (0.67%), and then actively managed ETFs (0.53%). Despite having the lowest asset weighted average total returns, actively managed ETFs have the highest risk-adjusted performance, with a monthly asset weighted average gross alpha of -0.05%. The differences between the equal weighted and asset weighted averages suggest that fund size has more impact on the risk-adjusted returns than total returns, and among the investing strategies it impacts actively managed ETFs the most.
Comparing the results for the pre- and post-implementation periods, we find that all three investing strategies show improved risk-adjusted performance{24} in the post-implementation period. However, there were no consistent directional changes in total returns. Both passively managed and strategic beta ETFs have improvements in their asset weighted average risk-adjusted returns, and these improvements are greater than the asset weighted average risk-adjusted returns for actively managed ETFs. It is worth noting that the asset weighted average gross alpha for strategic beta ETFs turned positive in the post-implementation period, and this is the only instance, at the fund characteristic level, where we observe a positive gross alpha.
Table 9. Summary of ETF Monthly Gross Performance by Investing Strategy
|
|
|
|
Total Return (%/month) |
Gross Alpha (%/month) |
|
|
|
||
|
||||||||||
Strategy |
Period |
No. of Obs. (Fund x Month) |
No. of Funds |
EW Mean |
AW Mean |
EW Mean |
AW Mean |
Average Age |
Average AUM ($ million) |
Total AUM ($ billion) |
|
||||||||||
Active |
2013-2020 |
3416 |
82 |
0.55 |
0.53 |
-0.14 |
-0.05 |
5.55 |
265.75 |
22.63 |
|
||||||||||
Active |
2013-2016 |
820 |
32 |
0.56 |
0.64 |
-0.44 |
-0.25 |
4.35 |
201.45 |
9.03 |
|
||||||||||
Active |
2017-2020 |
2596 |
82 |
0.55 |
0.5 |
-0.05 |
-0.01 |
5.93 |
285.7 |
22.63 |
|
||||||||||
Passive |
2013-2020 |
9226 |
130 |
0.61 |
0.67 |
-0.2 |
-0.19 |
8.05 |
729.02 |
122.63 |
|
||||||||||
Passive |
2013-2016 |
3688 |
102 |
0.54 |
0.54 |
-0.39 |
-0.41 |
6.77 |
637.76 |
69.91 |
|
||||||||||
Passive |
2017-2020 |
5538 |
130 |
0.65 |
0.74 |
-0.07 |
-0.07 |
8.9 |
790.15 |
122.63 |
|
||||||||||
Strategic Beta |
2013-2020 |
3949 |
79 |
0.68 |
0.75 |
-0.2 |
-0.12 |
6.45 |
223.27 |
15.69 |
|
||||||||||
Strategic Beta |
2013-2016 |
1173 |
40 |
0.72 |
0.79 |
-0.49 |
-0.42 |
5.51 |
250.69 |
10.08 |
|
||||||||||
Strategic Beta |
2017-2020 |
2776 |
79 |
0.66 |
0.73 |
-0.08 |
0.03 |
6.85 |
211.68 |
15.69 |
Table 10 presents the ETF performance findings by IFM firm type. The IFM firm types in our study sample are independent and bank-affiliated IFMs.
Our study sample is dominated by ETFs sponsored by independent IFMs (hereinafter independent ETFs). These ETFs account for 75% of funds and 73% of total AUM, at the end of 2020. In general, independent ETFs have larger average fund sizes than ETFs sponsored by bank-affiliated IFMs (hereinafter bank-sponsored ETFs). The average fund size was $522.3 million for independent ETFs and $477.4 million for bank-sponsored ETFs.
We observed that in our sample the asset weighted average total returns and risk-adjusted returns for independent ETFs were 0.68% and -0.19%, respectively. The corresponding numbers for bank-sponsored ETFs were 0.62% and -0.11%. Again, while there appeared to be differences in performance between the two IFM types, caution should be exercised in interpreting them. First, the difference between bank- and independent-sponsored ETFs' performance in our sample is only marginally statistically significant.{25} Second, as noted earlier, this is the difference in the sample mean only and does not account for the difference in the distribution of ETFs sponsored by each IFM firm type. Finally, as emphasized in Section 4 below, this result may depend on the measure of performance and our specific sample of ETFs.
Comparing the pre- and post-implementation period results, we find that both bank and independent ETFs saw increased total returns and risk-adjusted performance, in the post-implementation period. The effect of fund size on performance varied by IFM firm type and time period.
Table 10. Summary of ETF Monthly Gross Performance by IFM Firm Type
|
|
|
|
Total Return (%/month) |
Gross Alpha (%/month) |
|
|
|
||
|
||||||||||
Firm Type |
Period |
No. of Obs. (Fund x Month) |
No. of Funds |
EW Mean |
AW Mean |
EW Mean |
AW Mean |
Average Age |
Average AUM ($ million) |
Total AUM ($ billion) |
|
||||||||||
Independent |
2013-2020 |
12439 |
221 |
0.61 |
0.68 |
-0.2 |
-0.19 |
7.47 |
522.27 |
118.91 |
|
||||||||||
Independent |
2013-2016 |
4181 |
131 |
0.58 |
0.57 |
-0.42 |
-0.42 |
6.68 |
544.94 |
65.91 |
|
||||||||||
Independent |
2017-2020 |
8258 |
221 |
0.63 |
0.73 |
-0.08 |
-0.06 |
7.87 |
510.75 |
118.91 |
|
||||||||||
Bank |
2013-2020 |
4279 |
71 |
0.63 |
0.62 |
-0.16 |
-0.11 |
6.35 |
477.44 |
42.84 |
|
||||||||||
Bank |
2013-2016 |
1579 |
44 |
0.59 |
0.54 |
-0.41 |
-0.29 |
4.88 |
344.86 |
22.99 |
|
||||||||||
Bank |
2017-2020 |
2700 |
71 |
0.65 |
0.64 |
-0.01 |
-0.04 |
7.21 |
554.97 |
42.84 |
We discuss several limitations of our research findings in this section of the report.
Our study is an observational study, and as such the documented increase in the risk-adjusted returns for mutual funds and ETFs should be interpreted as correlation rather than causation. We cannot exclude the possibility that some of the improvements in the risk-adjusted returns are driven by other structural changes in the investment fund industry, broader macroeconomic conditions, and/or proposed regulatory changes.
Second, there is no consensus or industry-wide accepted standard of fund performance measures that allow for comparable analysis of funds with diverse risk exposures.{26} A large body of literature on methodologies to evaluate fund performance has emerged since Jensen (1968). Each of these methodologies have their own advantages and disadvantages. Though our chosen performance measure based on the prominent Fama and French (2015) model is the most widely used in academics, there are some criticisms of using the model for this purpose. Most notably, as pointed out by Berk and van Binsbergen (2017), benchmarking performance against the Fama and French (2015) model builds on the premise that investors' next best investment opportunities are spanned by the portfolios mimicking the model factors. However, these portfolios are not truly investible because they do not include transaction costs.
Finally, our research findings are based on a subset of mutual funds and ETFs, and as such our performance results may not be representative of the larger universe of mutual funds and ETFs. We caution readers from using our research results to make inferences about the performance of the broader universe of mutual funds and ETFs, from 2013 to 2020.
Post-implementation evaluation is crucial in the policy development cycle because it allows regulators to understand whether a newly introduced policy has been implemented as intended and is having the desired impacts and outcomes.
The purpose of this research is to examine the post-implementation impacts of the final phase of the Client Relationship Model (CRM2) amendments to National Instrument 31-103 Registration Requirements, Exemptions and Ongoing Registrant Obligations on industry behaviour. We specifically wanted to examine whether greater transparency about investment returns, in the annual costs and performance reports, is leading to improved risk-adjusted performance.
We find that the risk-adjusted performance for both mutual funds and ETFs is negative for the entirety of our study period, but performance improves in the years after the annual costs and performance reports were implemented.
Although our study cannot practically control for every factor that may influence our research findings, the results help provide evidence that disclosure-based regulations may be an effective tool in shifting industry behaviour.
The data sets that underpin our analysis were obtained directly from investment fund managers and third-party data providers, specifically ISS MI Investor Economics and Morningstar. Our data sets contained a total of 3,703 unique mutual funds for our study period. After filtering the funds by our selection criteria and eliminating funds with obvious reporting errors and missing data points our final sample size was 3,086 mutual funds and 299 ETFs. The 3,086 mutual funds were comprised of 13,356 unique fund series.
The following data points were sourced from ISS MI Investor Economics:
• Series type classification
• Investing strategy
• CIFSC classification (for ETFs only)
We use monthly returns and assets data from Morningstar Direct, and Product Type from investment fund managers.
The following criteria were used to select ETFs and mutual funds for inclusion in our analysis:
• The funds are domiciled in Canada and sold to Canadian retail investors{27}
• Mutual funds must be open-ended funds
• ETFs are Canadian listed ETFs
• Each fund must have gross monthly total return data for at least 36 consecutive months, between 2009 to 2020. Terminated and merged funds are included in our sample population if they can satisfy the monthly performance data criteria. These criteria were included to minimize survivorship bias in our sample population.
Investment performance evaluation has been studied extensively in the academic fund management literature.{28} Ever since the seminal paper by Jensen (1968), it has been established that in order to measure and compare fund performance, it is necessary to account for fund risk. Failure to do so would lead to a substantial overestimate of fund performance and an incorrect inference of average performance.{29} Moreover, subjecting fund returns to a common risk model renders an added bonus of making possible comparisons of fund performance among funds with diverse asset classes and risk exposures.
One of the most prominent models used to account for risk in the stock market is the Fama and French (2015) model, which has been found to explain patterns in stock returns consistently.{30}
Our approach to estimate risk-adjusted returns uses the Fama and French (2015) model, with five risk factors. We, however, include an additional bond factor, because our study sample includes both stock and bond funds.{31} The equation below is a mathematical representation of our performance model.{32}

Where:
• Rit is fund i's total returns (before expenses) in month t,
• Rft is the risk-free rate, and
• RtUSDCAD is the monthly change in the USD/CAD exchange rate.{33}
The explanatory factors MKTt, SMBt , HMLt , RMWt , and CMAt represent the common risk factors of the Fama and French (2015) model for equities; and MOMt is the Carhart (1997)'s momentum factor.{34} Finally, the factor WBt is the excess returns on a value-weight portfolio of global and Canadian bond indices, which represents the risks for bonds.{35}
The regression equation above shows that a fund's total returns in excess of the risk-free rate and the Canadian exchange rate can be explained by the Fama and French factors and a bond factor. The slopes (B[beta symbol unavailable]is) on the explanatory returns describe a fund's risk exposure to each of the common risk factors.
The intercept A[alpha symbol unavailable]i , which is the fund's alpha, measures a fund's average returns in excess of the returns explained by exposures to the risk factors and captures the fund's before-fee risk-adjusted performance.{36} A positive alpha is interpreted as "outperformance" and a negative alpha as "underperformance", relative to the expected returns implied by the risk exposures.{37} This model, therefore, attempts to measure the degree to which variations in a fund's past performance are explained by variations in the six factors.
It is worth noting that the Fama and French factors and the momentum factor are not available for Canada, thus we follow Cumming et al. (2019) and use the North American factors, which comprise constituents from both the Canadian and U.S. markets. This choice can be justified by extensive evidence of stock market integration between Canada and the United States due to their comprehensive economic ties.{38} More importantly, the use of these factors is supported by the high values of adjusted R2 when estimating the above equation. The average adjusted R2 is 88.4% and 84.3% for mutual funds and ETFs, respectively, indicating that about 84% to 88% of the variations in sample funds' returns are accounted for by the factors in our model.
We use a rolling-regression procedure to estimate the monthly risk-adjusted performance for each fund in our sample. For every month in our study period, we regress the gross total returns of each mutual fund series or ETF on the risk factors for the previous three years. The rolling regression provides time-varying estimates that can account for changes in market dynamics. Given that all mutual fund series of the same fund share a common underlying portfolio, the returns at the mutual fund series level should be similar.{39} Following conventions in mutual fund performance research we aggregate the series level estimates (using asset-weighted average) of the same fund to obtain the fund's overall risk-adjusted performance.{40}
We then derived equal weighted and asset weighted averages of fund performance, to compare performance by time periods and fund characteristics. The equal weighted performance metric represents a fund's performance on average, while the asset weighted average performance metric takes into account the effects of a fund's assets size on performance.
We perform statistical tests for our hypothesis using t-tests and regressions. The results are available for interested readers upon request.
Bekaert, G., Harvey, C.R., Lundblad, C. and S. Siegel, 2007. Global growth opportunities and market integration. The Journal of Finance 62: 1081 -- 1137.
Berk, J. B. and R. C. Green, 2004. Mutual fund flows and performance in rational markets. Journal of Political Economy 112: 1269 -- 1295.
Berk, J. B. and J. H. van Binsbergen, 2017. Mutual funds in equilibrium. Annual Review of Financial Economics 9: 147 -- 167.
Bloomberg, 2018. Bloomberg Barclays Methodology.
Brown, D. P. and Y. Wu, 2016. Mutual fund flows and cross-fund learning within families. Journal of Finance 71: 383 -- 424.
Brown, S., Goetzmann, W., Liang, B., and C. Schwarz, 2008. Mandatory disclosure and operational risk: Evidence from hedge fund registration. Journal of Finance 63: 2785 -- 2815.
Carhart, M.M., 1997. On Persistence in Mutual Fund Performance. The Journal of Finance 52: 57 -- 82.
Cochrane, J.H., 2005. Asset Pricing: Revised Edition. Princeton University Press, Princeton.
Cumming, D. J., Johan, S. A., and Y. Zhang, 2019. What is Mutual Fund Flow? Journal of International Financial Markets, Institutions and Money 62: 222 -- 251.
Dranove, D. and G. Z. Jin, 2010. Quality Disclosure: Theory and Practice. Journal of Economic Literature 48: 935 -- 963.
Evans, R. B., 2010. Mutual fund incubation. Journal of Finance 66: 1581 -- 1611.
Elton, E. J., Gruber, M. J., Da, S. and M. Hlavka, 1993. Efficiency with costly information: A reinterpretation of evidence for managed portfolios. Review of Financial Studies 6: 1 -- 22. Elton, E. J., Gruber, M. J. and C. R. Blake, 1996. The persistence of risk-adjusted mutual fund performance. Journal of Business 69: 133 -- 157.
Elton, E. J., Gruber, M. J. and C. R. Blake, 1996. Survivorship bias and mutual fund performance. Review of Financial Studies 9: 1097 -- 1120.
Elton, E. J. and C. R. Blake, 2013. Mutual Funds. Financial Markets and Asset Pricing: Handbooks of Economics and Finance. Edited by Constantinides, Harris, and Stulz.
Elton, E. J., M. J. Gruber and A. de Souza, 2019. Passive mutual funds and ETFS: Performance and Comparison. Journal of Banking and Finance 106: 265 -- 275.
Faff, R. W. and U. R. Mittoo, 2003. Capital market integration and industrial structure: the case of Australia, Canada and the United States. Journal of Economic Integration: 433 -- 465.
Fama, E. F. and K. R. French, 1993. Common risk factors in the returns on stocks and bonds. Journal of Financial Economics 33: 3 -- 56.
Fama, E. F. and K. R. French, 2010. Luck versus skills in the cross-section of mutual fund returns. Journal of Finance 65: 1915 -- 1947.
Fama, E. F. and K. R. French, 2015. A five-factor asset pricing model. Journal of Financial Economics 116: 1 -- 22.
Ferson, W. E., 2019. Empirical Asset Pricing Models and Methods. The MIT Press, Cambridge, Massachussets.
Ferson, W. E., 2010. Investment performance evaluation. Annual Review of Financial Economics 2: 207 -- 234.
Ferson, W. E. and J. Lin, 2014. Alpha and performance measurement: The effect of investor disagreement and heterogeneity. Journal of Finance 69: 1565 -- 1596.
Gil-Bazo, J. and P. Ruiz-Verdu, 2009. The relation between price and performance in mutual fund industry. Journal of Finance 64: 2153 -- 2183.
Gilmore, C.G. and G. M. McManus, 2004. The impact of NAFTA on the integration of the Canadian, Mexican, and U.S. equity markets. North American Economic and Financial Integration (Research in Global Strategic Management, Vol. 10): 137 -- 151. Edited by Rugman.
George, T. J. and C. Y. Hwang, 2015. Disclosure policy of investment funds. Quarterly Journal of Finance 5: 1 -- 49.
Guercio, D. and J. Reuter, 2014. Mutual fund performance and the incentive to generate alpha. Journal of Finance 69: 1673 -- 1704.
Honigsberg, C., 2019. Hedge fund regulation and fund governance: Evidence on the effects of mandatory disclosure rules. Journal of Accounting Research 57: 845 -- 888.
Harvey, C. R., 1991. The world price of covariance risk. The Journal of Finance 46: 111 -- 157.
Investor Economics, 2021. Insight Report January 2021.
Jensen, M. C., 1968. The performance of mutual funds in the period: 1945 -- 1964. Journal of Finance 23: 389 -- 416.
Leuz, C. and P. D. Wysocki, 2016. The economics of disclosure and financial reporting regulation: Evidence and suggestions for future research. Journal of Accounting Research 54: 525 -- 622.
Mittoo, U. R., 1992. Additional evidence on integration in the Canadian stock market. The Journal of Finance 47: 2035 -- 2054.
Morningstar Research, 2006. Standard performance calculation methodology.
Morningstar Research, 2018. Morningstar strategic beta and index attributes -- Methodology.
Mussa, M. M. and M. M. Goldstein, 1993. The integration of world capital markets. International Monetary Fund.
Pukthuanthong, K. and R. Roll, 2009. Global market integration: An alternative measure and its application. Journal of Financial Economics 94: 214 -- 232.
Shi, Z., 2017. The impact of portfolio disclosure on hedge fund performance. Journal of Financial Economics 126: 36 -- 53.
Wermers, R., 2000. Mutual fund performance: An empirical decomposition into stock-picking talent, style, transaction costs, and expenses. Journal of Finance 55: 1655 -- 1695.
Zingales, L., 2019. The future of securities regulations. Journal of Accounting Research 47: 391 -- 425.
{1} This report has benefited greatly from comments from internal and external peer reviewers. They include J. Ari Pandes, Haskayne School of Business, University of Calgary, and reviewers from The Investment Funds Institute of Canada (IFIC) and ISS MI Investor Economics. Any remaining errors of fact or interpretation are the sole responsibility of the authors.
{2} Risk-adjusted performance or risk-adjusted return is a rate of return that is relative to a/some benchmark(s). Specifically, we use a version of the Fama and French (2015) model as the common benchmark to measure risk-adjusted return in this report. See section Research Methodology in Appendix A for details.
{3} Gross performance allows the analysis of funds' performance to be independent of their fees and expenses, which are analyzed separately in a companion report entitled A Post-Implementation Review of the Impacts of the CRM2 Annual Costs and Performance Reports on Investment Fund Fees. We have also assessed net performance and obtained qualitatively similar conclusions (results available upon request).
{4} Note that the risk-adjusted performance is measured relative to our chosen benchmarks based on the Fama and French (2015) model. Negative risk-adjusted performance of a fund indicates that the fund underperforms the benchmarks used to account for the fund risk. It is important to highlight that our benchmarks are not necessarily the benchmark used by the funds in our sample, and thus negative risk-adjusted return does not imply that investors incurred losses from investing during our sample period. See section Research Methodology in Appendix A for details.
{5} The CRM2 amendments require dealers to disclose to their clients transaction information and total returns at the account level, expressed as a percentage, and on an annualized basis. The total return is net of fees and other charges.
{6} Leuz and Wysocki (2016) provide a comprehensive survey of the literature.
{7} See Dranove and Jin (2010) for more details.
{8} Investor Economics Household Balanced Sheet Report, 2014 and 2016. Discretionary financial assets are assets not held in employer sponsored pension plans.
{9} For the purpose of our research, we define an investment fund as an investment product, specifically a fund, that pools money from various investors and invest that money collectively through a portfolio of financial instruments, such as stocks and bonds, and the portfolio of investments is professionally managed by a fund manager. Based on this definition we have classified mutual funds and exchange traded funds (ETFs) as investment funds. While hedge funds satisfy our definition of an investment fund, we have excluded hedge funds from our analysis as these funds are only available to "accredited investors", who are institutional investors and a subset of high net worth retail investors.
{10} Investor Economics, Insight Report January 2021
{11} We have performed statistical tests for our hypothesis that the risk-adjusted performance (i.e., alpha) improves following the CRM2 implementations. Using both t-tests to compare the average alpha before and after the CRM2 implementations and regressions to estimate the impact of the CRM2 compliance on fund alpha controlling for fund characteristics, we find that the results are statistically significant at 0.1% level for both mutual funds and ETFs. The details of these tests are available upon request.
{12} We include fund age in our descriptive statistics because many studies have shown it as one of the variables that determine fund performance. It is well-documented that in the U.S mutual fund market, fund age has a negative relationship with mutual fund performance. See Brown and Wu (2016), Evan (2010) and others for detail.
{13} The total industry assets in December 2020 was $1.697 trillion. Source: Investor Economic Insight Report January 2021.
{14} We have reported the monthly returns as this is the convention in performance research. An annualized figure can be calculated from a monthly return by multiplying the monthly return by 12.
{15} Unless otherwise noted, alpha, risk-adjusted return, and risk-adjusted performance have the same meaning in our report.
{16} There are 3,086 unique mutual funds in our study sample. The number of mutual funds for each year of our study period, as laid out in Table 2, is less than 3,086 because within a given year new funds are introduced and existing funds are merged or terminated. If a fund has 36 consecutive months of performance data between 2009 and 2020 then the fund is counted in the total fund count. The inclusion of a fund in the annual fund count depends on when a fund is introduced, merged, or terminated. For example, a fund merged or terminated in 2018 is counted in the 2013 to 2018 statistics but is excluded from the 2019 and 2020 statistics.
{17} This drop is consistent with the broader trend in the mutual fund market. According to Investor Economics Insight Annual Review January 2023, during our sample period from 2013 -- 2020, the AUM of long-term investment funds in the market only fell in 2018 when net outflows of mutual funds amounted to $7.94 billion in December alone. See Investor Economics Insight Annual Review January 2019 for more details.
{18} There are four funds in our sample that do not have observations of product type.
{19} In one of our statistical tests, mentioned in footnote 10 above, we controlled for the type of IFM firms and found that effects of IFM firm type on alphas are statistically insignificant. This result is available upon request.
{20} This may be due to a more dynamic market structure in the ETF market, compared to the mutual fund market, which is characterized by more active trading, more liquidity, and arbitrage by authorized participants.
{21} Total industry assets as of December 2020 was $251 billion. Source: Investor Economic Insight Report, January 2021.
{22} Note that the total number of funds and total AUM, by asset class, may not add up to the corresponding totals for the sample because some ETFs have changed their asset class during our study period.
{23} Strategic beta ETFs are products that apply rules to a basket of securities (often represented by an index) to target companies that demonstrate specific "factors" such as value, momentum, or growth. Strategic beta ETFs are also known by other names such as smart beta or alternative beta. There is no universally accepted view as to whether strategic beta ETFs are passively managed investment funds or actively managed investment funds. For the purpose of our research, we have classified strategic beta ETFs as passively managed funds because they focus on a specific basket of securities, often represented by an index.
{24} Improvements were seen in both the equal weighted and asset weighted gross risk adjusted performance, i.e., gross alpha.
{25} In our statistical tests, mentioned in footnote 10 above, for the ETF sample, we controlled for IFM firm type and found that the difference in performance between bank-sponsored ETFs and independent ETFs was only statistically significant at 5% level. This result is available upon request.
{26} See Elton (2020), Wermers (2011), and Ferson (2010) for comprehensive reviews of performance measures.
{27} ETF assets include assets held by both retail and institutional investors. Mutual fund assets exclude mutual fund series sold to institutional investors.
{28} See Ferson (2010), Wermers (2011), and Elton (2020) for comprehensive reviews.
{29} See Elton et al. (1993 and 1996).
{30} See Cochrane (2005) and, more recently, Ferson (2019) for comprehensive reviews of empirical methods and models in finance.
{31} See Elton et al. (1996)
{32} In addition to estimating this model, we also estimated various permutations of the explanatory risk factors. We settled on this model because it produced the highest adjusted R squared on average. The adjusted R squared, one of the most common measures used for model selection, is a corrected "goodness-of-fit" measure for linear regression models. The adjusted R squared measures how well the predictor variables, in our case the risk factors, explain the estimated gross alpha. The higher the adjusted R squared, the better the model's explanatory power.
{33} We adjust a fund's returns for the USD/CAD exchange rate because while a funds' returns are measured in Canadian dollar, the explanatory risk factors on the right hand-side of our equation are measured in U.S. dollars.
{34} Specifically, MKT, the market factor, is the return on the market portfolio in excess of the risk-free rate; and SMB, HML, RMW, CMA, and MOM are the returns on the value-weighted, zero-investment factor-mimicking portfolios for size, book-to-market ratio, profitability, investment, and one-year momentum in stock returns. For details of how to construct the Fama and French (2015) factors, please refer to Prof. Kenneth French's webpage at https://mba.tuck.dartmouth.edu/pages/faculty/ken.french/data_library.html#Benchmarks.
{35} The bond indices are total returns index, including the Bloomberg Barclays Global Aggregate Bond Index, Bloomberg Barclays Global High Yield Index, Bloomberg Barclays Global Inflation Linked Index, and Bloomberg Barclays Canadian Aggregate Bond Index.
{36} Note that the risk factors include the returns for both the equity and bond markets that are subtracted from total returns when calculating alpha. Hence, unlike total returns, the risk-adjusted return or alpha is independent of the equity and bond market performance.
{37} We caution that risk-adjusted return is defined, and therefore, must be interpreted within the context of a specific risk model that has been selected to benchmark a fund's performance. Our chosen version of the Fama and French (2015) model may not be the performance benchmark that an IFM has chosen for its funds. Consequently, a fund's negative risk-adjusted returns based on our estimation simply means that the fund' expected returns is lower than the expected returns of our model and does not necessarily imply a loss of wealth for the fund's investors.
{38} See, for example, Harvey (1991), Mittoo (1992), Mussa and Goldstein (1993), Faff and Mittoo (2003), Glimore and McManus (2004), Bekaert et al. (2007), and Pukthuanthong and Roll (2009)).
{39} See Morningstar (2006) for details.
{40} See, for example, Ferson and Lin (2014) and Fama and French (2015) among others.
National Policy 11-206 Process for Cease to be a Reporting Issuer Applications -- The issuer ceased to be a reporting issuer under securities legislation.
Securities Act, R.S.O. 1990, c. S.5, as am., s. 1(10)(a)(ii).
April 18, 2024
The principal regulator in the Jurisdiction has received an application from the Filer for an order under the securities legislation of the Jurisdiction of the principal regulator (the Legislation) that the Filer has ceased to be a reporting issuer in all jurisdictions of Canada in which it is a reporting issuer (the Order Sought).
Under the Process for Cease to be a Reporting Issuer Applications (for a passport application):
a) the Ontario Securities Commission is the principal regulator for this application, and
b) the Filer has provided notice that subsection 4C.5(1) of Multilateral Instrument 11-102 Passport System (MI 11-102) is intended to be relied upon in British Columbia and Alberta.
Terms defined in National Instrument 14-101 Definitions and MI 11-102 have the same meaning if used in this order, unless otherwise defined.
This order is based on the following facts represented by the Filer:
1. the Filer is not an OTC reporting issuer under Multilateral Instrument 51-105 Issuers Quoted in the U.S. Over-the-Counter Markets;
2. the outstanding securities of the Filer, including debt securities, are beneficially owned, directly or indirectly, by fewer than 15 securityholders in each of the jurisdictions of Canada and fewer than 51 securityholders in total worldwide;
3. no securities of the Filer, including debt securities, are traded in Canada or another country on a marketplace as defined in National Instrument 21-101 Marketplace Operation or any other facility for bringing together buyers and sellers of securities where trading data is publicly reported;
4. the Filer is applying for an order that the Filer has ceased to be a reporting issuer in all of the jurisdictions of Canada in which it is a reporting issuer; and
5. the Filer is not in default of securities legislation in any jurisdiction.
The principal regulator is satisfied that the order meets the test set out in the Legislation for the principal regulator to make the order.
The decision of the principal regulator under the Legislation is that the Order Sought is granted.
OSC File #: 2024/0179
Trilogy International Partners Inc.
Multilateral Instrument 11-102 Passport System and National Policy 11-206 Process for Cease to be a Reporting Issuer Applications -- Securities Act s. 88 Cease to be a reporting issuer in BC -- The securities of the issuer are beneficially owned by not more than 50 persons and are not traded through any exchange or market -- The issuer is not an OTC reporting issuer; the securities of the issuer are beneficially owned by fewer than 15 securityholders in each of the jurisdictions of Canada and fewer than 51 securityholders worldwide; no securities of the issuer are traded on a market in Canada or another country; the issuer is not in default of securities legislation.
National Policy 11-206 Process for Cease to be a Reporting Issuer Applications -- The issuer ceased to be a reporting issuer under securities legislation.
Securities Act, R.S.B.C. 1996, c. 418, s. 88.
Securities Act, R.S.O. 1990, c. S.5, as am., s. 1(10)(a)(ii).
Citation: 2024 BCSECCOM 146
April 17, 2024
¶ 1 The securities regulatory authority or regulator in each of the Jurisdictions (the Decision Maker) has received an application from the Filer for an order under the securities legislation of the Jurisdictions (the Legislation) that the Filer has ceased to be a reporting issuer in all jurisdictions of Canada in which it is a reporting issuer (the Order Sought).
Under the Process for Cease to be a Reporting Issuer Applications (for a dual application):
(a) the British Columbia Securities Commission is the principal regulator for this application;
(b) the Filer has provided notice that subsection 4C.5(1) of Multilateral Instrument 11-102 Passport System (MI 11-102) is intended to be relied upon in Alberta, Saskatchewan, Manitoba, Québec, New Brunswick, Nova Scotia, Prince Edward Island, Newfoundland and Labrador, Yukon Territory, Northwest Territories and Nunavut; and
(c) the order is the order of the principal regulator and evidences the decision of the securities regulatory authority or regulator in Ontario.
¶ 2 Terms defined in National Instrument 14-101 Definitions and MI 11-102 have the same meaning if used in this order, unless otherwise defined.
¶ 3 This order is based on the following facts represented by the Filer:
1. the Filer is not an OTC reporting issuer under Multilateral Instrument 51-105 Issuers Quoted in the US. Over-the-Counter Markets;
2. the outstanding securities of the Filer, including debt securities, are beneficially owned, directly or indirectly, by fewer than 15 securityholders in each of the jurisdictions of Canada and fewer than 51 securityholders in total worldwide;
3. no securities of the Filer, including debt securities, are traded in Canada or another country on a marketplace as defined in National Instrument 21-101 Marketplace Operation or any other facility for bringing together buyers and sellers of securities where trading data is publicly reported;
4. the Filer is applying for an order that the Filer has ceased to be a reporting issuer in all of the jurisdictions of Canada in which it is a reporting issuer; and
5. the Filer is not in default of securities legislation in any jurisdiction.
¶ 4 Each of the Decision Makers is satisfied that the order meets the test set out in the Legislation for the Decision Maker to make the order.
The decision of the Decision Makers under the Legislation is that the Order Sought is granted.
OSC File #: 2024/0151
National Policy 11-207 Failure-to-File Cease Trade Orders and Revocations in Multiple Jurisdictions -- application for partial revocation of failure-to-file cease trade order -- issuer cease traded due to failure to file with the Commission interim financial statements, related management's discussion and analysis and related certifications -- issuer has applied for a partial revocation of the cease trade order to permit trades of securities of the issuer in connection with a court-approved transaction under the Companies' Creditors Arrangement Act -- partial revocation granted subject to conditions.
Securities Act, R.S.O. 1990, c. S.5, as am., s. 144.
National Policy 11-207 Failure-to-File Cease Trade Orders and Revocations in Multiple Jurisdictions.
1. Humble & Fume Inc. (the Issuer) is subject to a failure-to-file cease trade order (the FFCTO) issued by the Ontario Securities Commission (the Principal Regulator) on December 5, 2023.
2. The Issuer has applied to the Principal Regulator pursuant to section 144 of the Securities Act (Ontario) for a partial revocation order of the FFCTO.
3. Terms defined in National Instrument 14-101 Definitions or National Policy 11-207 Failure-to-File Cease Trade Orders and Revocations in Multiple Jurisdictions have the same meaning if used in this order, unless otherwise defined.
4. This decision is based on the following facts represented by the Issuer:
(a) The Issuer was incorporated under the Business Corporations Act (Ontario) on February 15, 2007.
(b) The Issuer is a reporting issuer in each of Alberta, British Columbia and Ontario.
(c) The Issuer's registered and head office is located at 77 King St. West, TD North Tower, Suite 700, Toronto, Ontario, M5K 1G8, Canada.
(d) The Issuer is a distributor of cannabis accessories and provides a fully integrated cannabis accessories distribution solution with complete sales, distribution, and trade market support.
(e) The authorized capital of the Issuer consists of an unlimited number of common shares (the Common Shares). As at the date hereof, there are approximately 124,188,060 Common Shares issued and outstanding. The Issuer also has approximately 15,569,500 warrants, 4,176,475 options, 1,849,068 restricted share units and $1,540,000 in principal amount of subordinated secured convertible debentures outstanding (the Convertible Debentures), which Convertible Debentures shall be repaid in connection with the Transaction. The Issuer has no other outstanding securities (including debt securities).
(f) The Common Shares were listed on the Canadian Securities Exchange (the CSE) under the symbol "HMBL". The Common Shares were delisted from the CSE as a result of the failure of the Issuer to meet the continued listing requirements of the CSE on March 20, 2024. The Common Shares are also quoted and currently halted for trading on the OTCQX in the United States under the symbol "HUMBF".
(g) Following completion of the Transaction (as hereinafter defined), the Issuer intends to apply for a full revocation of the FFCTO.
(h) The FFCTO was issued as a result of the Issuer's failure to file the following continuous disclosure materials as required by applicable Canadian securities laws:
(i) interim financial statements for the period ended September 30, 2023;
(ii) management's discussion and analysis relating to the interim financial statements for the period ended September 30, 2023; and
(iii) certification of the foregoing filings as required by National Instrument 52109 Certification of Disclosure in Issuers' Annual and Interim Filings (NI 52-109).
(collectively, the Initial Unfiled Documents)
(i) Following the issuance of the FFCTO, the Issuer failed to file the following continuous disclosure materials as required by applicable Canadian securities laws:
(i) interim financial statements for the period ended December 31, 2023;
(ii) management's discussion and analysis relating to the interim financial statements for the period ended December 31, 2023; and
(iii) certification of the foregoing filings as required by NI 52-109. (together with Initial Unfiled Documents, the Unfiled Documents)
(j) In light of ongoing financial difficulties, the Issuer and its subsidiaries (the Humble Group) filed for credit protection under the Companies' Creditors Arrangement Act (the CCAA) and received an order (the Initial Order) for creditor protection under the CCAA from the Ontario Superior Court of Justice (Commercial List) (the Court) on January 5, 2024 (the CCAA Proceedings).
(k) Pursuant to the Initial Order, the Court, inter alia, appointed Deloitte Restructuring Inc. as monitor (in such capacity, the Monitor) of the Humble Group under the CCAA Proceedings.
(l) On January 24, 2024, the Court granted an order (the SISP Order) authorizing the Monitor to conduct, with the assistance of the Issuer, a sale and investment solicitation process intended to solicit interest in the opportunity for a sale of or investment in all or part of the Issuer's assets and business operations.
(m) On January 23, 2024, the Issuer and 1000760498 Ontario Inc. (the Purchaser), entered into a stalking-horse agreement which was amended and restated on March 5, 2024 (as amended, the Purchase Agreement), pursuant to which the Purchaser agreed to purchase the shares of the Issuer and the shares of B.O.B. Headquarters Inc. (BobHq), a subsidiary of the Issuer, in exchange for the assumption, by the Purchaser, of certain of the Humble Group's secured debt (the Transaction).
(n) On March 7, 2024, the Court approved the Purchase Agreement, as amended, and granted two Sale and Approval and Vesting Orders under the CCAA (the Vesting Orders). The Vesting Orders approve the Purchase Agreement and the Transaction noted therein, including, among other things: (i) the sale and issuance by the Issuer of 100,000,000,000 Common Shares (the Purchased Shares) to the Purchaser and the transfer of all of the issued and outstanding shares of BobHq to the Purchaser in exchange for the assumption, by the Purchaser, of certain of the Humble Group's secured debt, (ii) authorized the transfer and vesting of all of Humble Group's right, title and interest in certain excluded assets, and excluded liabilities to "Residual Co.", (iii) authorized and directed the Issuer to issue the Purchased Shares to the Purchaser, and vest in the Purchaser, all right title and interest in and to the Purchased Shares, (iv) authorized the termination and cancellation all capital shares, capital stock partnership, membership, joint venture or other ownership or equity interest, participation or securities (whether voting or non-voting, whether preferred, common or otherwise, and including share appreciation, contingent interest or similar rights) of the Issuer other than the Purchased Shares, and (v) approved a claims process pursuant to which claimants may file claims against the Humble Group.
(o) The Transaction constitutes a "business combination" under Multilateral Instrument 61-101 (MI 61-101) pursuant to which the Purchaser, a related party of the Issuer, will acquire the Humble Group. However, the Transaction is exempt from the formal valuation requirements set out in MI 61-101 as at the time of the Transaction, the securities of the Issuer were not listed or quoted on one of the exchanges or markets specifically identified in MI 61-101. The Issuer did not seek minority shareholder approval for the Transaction as the Court waived any requirements for shareholder approval under the Vesting Orders.
(p) In connection with carrying out the SISP Order and obtaining the Vesting Orders, the Issuer has engaged in certain acts in furtherance of trades in the securities of the Issuer, including its entry into the Purchase Agreement (the Acts), which Acts were taken at the direction of, and with the approval of, and under the supervision of, the Court. Except for the Acts and the Unfiled Documents, the Issuer is not in default of any requirements of the FFCTO, the securities legislation of any jurisdiction in which the Issuer is a reporting issuer (the Legislation), or the rules and regulations made pursuant thereto.
(q) Since the issuance of the FFCTO, there have not been any material changes in the business, operations or affairs of the Issuer that have not been disclosed to the public apart from matters relating to the CCAA Proceedings and the Transaction, materials for which are available through the Monitor and posted on the Monitor's website.
(r) As the Transaction will involve trades in securities of the Issuer, the closing of the Transaction is conditional on the partial revocation of the FFCTO.
(s) The issuance of the Purchased Shares by the Issuer will occur in Ontario.
(t) The Purchased Shares will not be qualified for distribution to the public under any applicable Canadian securities laws and will be subject to restrictions on transfer in Canada.
(u) Following completion of the Transaction, all securities of the Issuer will remain subject to the FFCTO until a full revocation of the FFCTO is granted.
(v) Other than the Transaction, no further trading in securities of the Issuer will be made by the Issuer unless further relief from the FFCTO is sought by the Issuer or a full revocation of the FFCTO is granted.
(w) Following completion of the Transaction, the Issuer intends to apply for a full revocation of the FFCTO.
5. The Principal Regulator is satisfied that a partial revocation order of the FFCTO meets the test set out in the Legislation for the Principal Regulator to make the decision.
6. The decision of the Principal Regulator under the Legislation is that the FFCTO is partially revoked solely to permit the trades in securities of the Issuer (including for greater certainty, acts in furtherance of trades in securities of the Issuer) that are necessary for and are in connection with the Transaction, provided that:
(a) prior to completion of the Transaction, the Purchaser will receive:
(i) a copy of the FFCTO;
(ii) a copy of this order; and
(iii) written notice from the Issuer, to be acknowledged by the Purchaser in writing (the Acknowledgement), that all of the Issuer's securities, including the securities issued in connection with the Transaction, will remain subject to the FFCTO unless further relief is granted or until a full revocation order is granted, the issuance of which is not certain;
(b) the Issuer undertakes to make available a copy of the Acknowledgement to staff of the Principal Regulator upon request; and
(c) this order will terminate on the earlier of:
(i) the completion of the Transaction; and
(ii) 60 days from the date hereof.
DATED this 19th day of April, 2024.
OSC File #: 2024/0132
Intellabridge Technology Corporation
National Policy 11-207 Failure-to-File Cease Trade Orders and Revocations in Multiple Jurisdictions -- Application by an issuer for a revocation of a cease trade order issued by the Commission -- cease trade order issued because the issuer failed to file certain continuous disclosure materials required by Ontario securities law -- defaults subsequently remedied by bringing continuous disclosure filings up to date -- cease trade order revoked.
Securities Act, R.S.O. 1990, c. S.5, as am., s. 144.
National Policy 11-207 Failure-to-File Cease Trade Orders and Revocations in Multiple Jurisdictions.
1. Intellabridge Technology Corporation (the Issuer) is subject to a failure-to-file cease trade order (the FFCTO) issued by the Ontario Securities Commission (the Principal Regulator) on May 6, 2022.
2. The Issuer has filed the periodic continuous disclosure documents required under the Legislation.
Terms defined in National Instrument 14-101 Definitions and National Policy 11-207 Failure-to-File Cease Trade Orders and Revocations in Multiple Jurisdictions have the same meaning if used in this order, unless otherwise defined.
3. The Principal Regulator is satisfied that the order to revoke the FFCTO meets the test set out in the Legislation for the Principal Regulator to make the decision.
4. The decision of the Principal Regulator under the Legislation is that the FFCTO is revoked.
DATED at Toronto this 12th day of April, 2024.
OSC File #: 2023/0305
National Policy 11-203 Process for Exemptive Relief Applications in Multiple Jurisdictions -- National Instrument 52-107 Acceptable Accounting Principles and Auditing Standards (NI 52-107) -- the Filer requested relief from the requirement under section 3.3 of NI 52-107 that financial statements be audited in accordance with Canadian GAAS -- the Filer is an SEC Issuer that is planning to spin off certain assets to a newly created company (SpinCo) -- the financial statements of the spin-out business and SpinCo in the circular will be audited in accordance with U.S. GAAS -- Spinco will not meet the definition of SEC Issuer in NI 52-107 at the time of the filing of the circular -- Spinco will meet the definition of SEC Issuer upon completion of the separation -- if SpinCo does not become an SEC Issuer, the Filer and SpinCo will immediately re-file the financial statements audited in accordance with Canadian GAAS.
National Instrument 52-107 Acceptable Accounting Principles and Auditing Standards, s. 3.3.
Citation: Re TC Energy Corporation, 2024 ABASC 25
February 12, 2024
The securities regulatory authority or regulator in each of the Jurisdictions (each, a Decision Maker) has received an application (the Application) from the Filer for a decision under the securities legislation of the Jurisdictions (the Legislation), exempting the Filer from the following:
(a) in respect of the Spin-Out Financial Statements (as defined herein), the requirements in sections 3.2(1) and 3.14(1), as applicable, of National Instrument 52-107 Acceptable Accounting Principles and Auditing Standards (NI 52-107), which provide, among other things, that certain financial statements must be prepared in accordance with Canadian GAAP applicable to publicly accountable enterprises; and
(b) in respect of the Annual Carve-Out Financial Statements (as defined herein), the requirement in section 3.3(1)(a) of NI 52-107, which provides, among other things, that certain financial statements must be audited in accordance with Canadian GAAS and accompanied by an auditor's report that includes certain prescribed items,
in each case, with respect to certain financial statements to be included in a management information circular of the Filer (the Circular) prepared in connection with a special meeting of the Filer's shareholders (the Meeting) to consider the Separation (as defined herein) (collectively, the Exemption Sought).
The Decision Makers have also received a request from the Filer for a decision that the Application, any supporting materials delivered in connection with the Application, and this decision (the Confidential Material) be kept confidential and not be made public until the earliest of: (i) 90 days from the date of this decision; (ii) the date on which the Circular is mailed to Shareholders (as defined herein); and (iii) the announcement or written confirmation by the Filer that it will not proceed with the Separation (the Confidentiality Relief).
Under the Process for Exemptive Relief Applications in Multiple Jurisdictions (for a dual application):
(a) the Alberta Securities Commission is the principal regulator for this application;
(b) the Filer has provided notice that section 4.7(1) of Multilateral Instrument 11-102 Passport System (MI 11-102) is intended to be relied upon in respect of the Exemption Sought and the Confidentiality Relief in each of British Columbia, Saskatchewan, Manitoba, Québec, New Brunswick, Prince Edward Island, Nova Scotia, Newfoundland and Labrador, Yukon, Northwest Territories and Nunavut; and
(c) this decision is the decision of the principal regulator and evidences the decision of the securities regulatory authority or regulator in Ontario.
Terms defined in National Instrument 14-101 Definitions, NI 52-107 and MI 11-102 have the same meaning if used in this decision, unless otherwise defined.
This decision is based on the following facts represented by the Filer:
1. The Filer is a corporation governed by the Canada Business Corporations Act.
2. The head and registered office of the Filer is located in Calgary, Alberta.
3. The Filer is a reporting issuer in each of the provinces and territories of Canada and is not in default of securities legislation in any jurisdiction of Canada.
4. The Filer's common shares are listed on the Toronto Stock Exchange (TSX) and the New York Stock Exchange (NYSE).
5. The Filer is an "SEC issuer" as defined in NI 52-107.
6. The Filer's financial year end is December 31.
7. The Filer's financial statements are prepared in accordance with U.S. GAAP and are audited in accordance with U.S. PCAOB GAAS in accordance with sections 3.7(1) and 3.8(1) of NI 52-107, respectively.
8. The Filer operates in three core businesses: (i) Natural Gas Pipelines; (ii) Liquids Pipelines (the Liquids Business); and (iii) Power and Energy Solutions.
9. On July 27, 2023, the Filer announced its intention to advance a separation of its business into two independent reporting issuers through the "spinoff" of the Liquids Business into a new reporting issuer (SpinCo) by way of a plan of arrangement under the Canada Business Corporations Act (the Separation).
10. Pursuant to the Separation, holders of the Filer's common shares (Shareholders) will retain their existing ownership in the Filer's common shares and receive a pro rata allocation of common shares in SpinCo.
11. It is expected that SpinCo will be incorporated under the Canada Business Corporations Act in the first half of 2024.
12. Prior to the completion of the Separation, SpinCo will not be a reporting issuer in any province or territory of Canada (or the equivalent thereof in any other jurisdiction), nor will it carry on any business or have any assets or liabilities.
13. The head and registered office of SpinCo will be located in the Province of Alberta.
14. Completion of the Separation is subject to the receipt of certain approvals, including the approval of the directors of the Filer and the Shareholders at the Meeting.
15. In connection with the Meeting, the Filer will deliver to Shareholders the Circular, which will include certain disclosure with respect to the Separation, including: (i) audited financial statements of SpinCo prepared in accordance with section 32.2 of Form 41-101F1 Information Required in a Prospectus (Form 41-101F1) (the SpinCo Audited Financial Statements); (ii) pro forma financial statements of SpinCo prepared in accordance with section 32.7 of Form 41-101F1 (the SpinCo Pro Forma Financial Statements); (iii) annual carve-out financial statements for the Liquids Business prepared in accordance with section 32.2 of Form 41-101F1 (the Annual Carve-Out Financial Statements); and (iv) if applicable, interim carve-out financial statements for the Liquids Business prepared in accordance with section 32.3 of Form 41-101F1 (the Interim Carve-Out Financial Statements and, together with the Annual Carve-Out Financial Statements, the Carve-Out Financial Statements). The SpinCo Audited Financial Statements, SpinCo Pro Forma Financial Statements and Carve-Out Financial Statements are collectively referred to herein as the Spin-Out Financial Statements.
16. To ensure that Shareholders receive comparable, consistent, decision-useful disclosure in respect of the Separation, the Filer wishes to prepare the Spin-Out Financial Statements in accordance with U.S. GAAP, and to have the Annual Carve-Out Financial Statements audited in accordance with U.S. PCAOB GAAS.
17. Pursuant to section 3.2(1) of NI 52-107, the SpinCo Audited Financial Statements and the Carve-Out Financial Statements must be prepared in accordance with Canadian GAAP applicable to publicly accountable enterprises.
18. Pursuant to sections 3.2(1) and 3.14(1) of NI 52-107, the SpinCo Pro Forma Financial Statements must be prepared in accordance with Canadian GAAP applicable to publicly accountable enterprises.
19. Pursuant to section 3.3(1)(a) of NI 52-107, the SpinCo Audited Financial Statements and the Annual Carve-Out Financial Statements must be audited in accordance with Canadian GAAS and accompanied by an auditor's report that includes certain prescribed items.
20. Pursuant to section 3.7(1) of NI 52-107, despite section 3.2(1) of NI 52-107, certain financial statements of an SEC issuer may be prepared in accordance with U.S. GAAP.
21. Pursuant to section 3.8(1) of NI 52-107, despite section 3.3(1) of NI 52-107, certain financial statements of an SEC issuer may be audited in accordance with U.S. PCAOB GAAS and accompanied by an auditor's report that includes certain prescribed items.
22. An "SEC issuer" is defined in NI 52-107 to mean "an issuer that has a class of securities registered under section 12 of the 1934 Act or is required to file reports under section 15(d) of the 1934 Act..."
23. In connection with the Separation, application will be made to list the common shares of SpinCo on the TSX and the NYSE and a registration statement on Form 40-F will be filed with the SEC (the Registration Statement), which will become effective concurrently with the completion of the Separation.
24. The Filer anticipates that, upon the completion of the Separation or shortly thereafter, SpinCo will be an "SEC issuer"; however, at the time of filing the Circular, SpinCo will not qualify as an "SEC issuer".
Each of the Decision Makers is satisfied that the decision concerning the Exemption Sought meets the test set out in the Legislation for the Decision Makers to make the decision.
The decision of the Decision Makers under the Legislation is that the Exemption Sought is granted, provided that:
(a) the Filer prepares the Spin-Out Financial Statements in accordance with U.S. GAAP;
(b) the Annual Carve-Out Financial Statements are audited in accordance with U.S. PCAOB GAAS and accompanied by an auditor's report that includes the items prescribed by section 3.8(1) of NI 52-107;
(c) the Filer discloses in the Circular that it is relying on the Exemption Sought;
(d) the Filer files the Registration Statement with the SEC within two business days following the date on which the Circular is mailed to Shareholders;
(e) if the Separation is completed and SpinCo does not become an "SEC issuer" within 20 days following the completion of the Separation, the Filer and SpinCo will immediately re-file, on their respective SEDAR+ profiles (collectively, the Amended Documents): (i) the SpinCo Audited Financial Statements, which shall be prepared in accordance with Canadian GAAP applicable to publicly accountable enterprises, audited in accordance with Canadian GAAS and accompanied by an auditor's report that includes the items prescribed by section 3.3(1)(a) of NI 52-107; (ii) the SpinCo Pro Forma Financial Statements, which shall be prepared in accordance with Canadian GAAP applicable to publicly accountable enterprises; (iii) the Annual Carve-Out Financial Statements, which shall be prepared in accordance with Canadian GAAP applicable to publicly accountable enterprises, audited in accordance with Canadian GAAS and accompanied by an auditor's report that includes the items prescribed by section 3.3(1)(a) of NI 52-107; (iv) if applicable, the Interim Carve-Out Financial Statements, which shall be prepared in accordance with Canadian GAAP applicable to publicly accountable enterprises; and (v) the Management's Discussion & Analysis corresponding to each of the financial statements required under subparagraphs 1(e)(iii)-(iv) of this decision, prepared in accordance with Form 51-102F1; and
(f) the Filer and SpinCo will issue a news release upon re-filing the Amended Documents that explains the nature and purpose of the re-filings.
The decision of the Decision Makers under the Legislation is that the Confidentiality Relief is granted.
OSC File #: 2023/0506
Polaris Financial Inc. and Quintessence Wealth
Under paragraph 4.1(1) (a) and (b) of National Instrument 31-103 Registration Requirements, Exemptions and Ongoing Registrant Obligations a registered firm must not permit an individual to act as a dealing, advising or associate advising representative of the registered firm if the individual acts as an officer, partner or director of another registered firm that is not an affiliate or is registered as a dealing, advising or associate advising representative of another registered firm. One registered firm is acquiring certain client accounts of another registered firm prior to the latter's surrender of its registration as a portfolio manager. The Filers have valid business reasons for the individual to be registered with both firms; the individual will have sufficient time to adequately serve both firms; and there are policies and procedures in place to handle any potential conflicts of interest. The firms are exempted from the prohibition in paragraphs 4.1(1)(a) and (b) for a limited time period.
Multilateral Instrument 11-102 Passport System, s. 4.7.
National Instrument 31-103 Registration Requirements, Exemptions and Ongoing Registrant Obligations, ss. 4.1 and 15.1.
April 16, 2024
The principal regulator in the Jurisdiction (the Decision Maker) has received an application from the Filers for a decision under the securities legislation of the Jurisdiction (the Legislation), pursuant to section 15.1 of National Instrument 31-103 Registration Requirements, Exemptions and Ongoing Registrant Obligations (NI 31-103), for an exemption from the restrictions in paragraphs 4.1(1)(a) and (b) of NI 31-103 to permit James Steel (the Representative) to be registered as an advising representative of QWealth while being an advising representative, director and officer of Polaris for a limited period of time following the acquisition of all segregated managed account clients of Polaris by QWealth (the Exemption Sought).
Under the Process for Exemptive Relief Applications in Multiple Jurisdictions (for a passport application):
(a) the Ontario Securities Commission (OSC) is the principal regulator of the Filers for this application, and
(b) the Filers have provided notice that subsection 4.7(1) of Multilateral Instrument 11-102 Passport System (MI 11-102) is intended to be relied upon in Alberta, British Columbia, Manitoba, New Brunswick, Newfoundland and Labrador, Nova Scotia, Prince Edward Island, Québec, Saskatchewan.
Terms defined in National Instrument 14-101 Definitions and MI 11-102 have the same meaning if used in this decision, unless otherwise defined.
This decision is based on the following facts represented by the Filers:
Polaris
1. Polaris is a corporation existing under the laws of the Province of Ontario with its head office in Ontario. Polaris is registered as a portfolio manager in the provinces of Alberta, British Columbia, Nova Scotia, Ontario, and Quebec. Its principal regulator is the OSC.
2. Polaris uses its portfolio manager category of registration to advise segregated managed accounts.
3. Polaris is not in default of any requirement of securities legislation in any jurisdiction of Canada.
4. The Representative is the president and a director of Polaris. He is also registered as its ultimate designated person (UDP), chief compliance officer (CCO) and is an advising representative of Polaris.
Quintessence Wealth
5. QWealth is a partnership existing under the laws of the Province of Ontario with its head office in Ontario. QWealth is registered as a portfolio manager in Alberta, British Columbia, Manitoba, New Brunswick, Newfoundland and Labrador, Nova Scotia, Ontario, Prince Edward Island, Quebec, and Saskatchewan, as an exempt market dealer in Alberta, British Columbia, Manitoba, New Brunswick, Newfoundland and Labrador, Nova Scotia, Ontario, Quebec, and Saskatchewan, and as an investment fund manager in Ontario, Quebec and Newfoundland and Labrador. Its principal regulator is the OSC.
6. QWealth uses its investment fund manager category of registration to manage the day-to-day operations of proprietary funds, uses its exempt market dealer category of registration to engage in acts in furtherance of trades for business purposes and uses its portfolio manager category of registration to provide investment advice to clients, including segregated managed accounts and investment funds. QWealth has ongoing business model terms and conditions imposed on its registration since 2023.
7. QWealth is not in default of any requirement of securities legislation in any jurisdiction of Canada.
The Transaction
8. The Filers are each independently owned and are not affiliates of one another.
9. The application for the Exemption Sought is made in relation to the transfer of client accounts of two advising representatives and an associate advising representative of Polaris to QWealth (the Transaction). In connection with the Transaction, the Representative is seeking registration as an advising representative of QWealth under the securities legislation of each of the jurisdictions where QWealth is registered.
10. The OSC provided its non-objection to the Transaction on March 27, 2024 thus allowing Polaris to initiate the transfer of client accounts in relation to the Transaction to QWealth (the Account Transfer Date). Polaris will transfer client accounts to QWealth in a timely manner.
11. Upon the completion of the transfer or closure of all client accounts, Polaris will apply to surrender its registration as a portfolio manager.
Dual Registration
12. During the period from the Account Transfer Date to the date that the firm surrender of Polaris is accepted by the OSC, Polaris and QWealth require the Representative to be:
(a) an officer, director and advising representative of Polaris to facilitate the orderly wind-up of Polaris' registerable business and operations and ensure appropriate client accounts transfers; and
(b) an advising representative of QWealth, to provide advisory services in relation to former clients of Polaris who will become clients of QWealth that are similar to the advisory services he performed on behalf of Polaris.
13. After the Account Transfer Date, the Representative, as Polaris' director, officer, UDP and CCO, will act in such capacity only to comply with regulatory requirements, including working to transfer Polaris' client accounts to QWealth or to another registered firm.
14. The Filers are aware that not all client accounts will be able to move from Polaris to QWealth at the same time and as such, some client accounts would be reassigned to the Representative on a temporary basis. In respect of each client account reassigned to the Representative on a temporary basis, the Representative will comply with all obligations set out in NI 31-103, including know your client, know your product and suitability determination requirements.
15. The Representative will have sufficient time and resources to adequately meet his obligations to each of Polaris and QWealth. Each Filers' respective CCO and UDP will ensure that the Representative has sufficient time and resources to adequately serve each Filer and its clients.
16. The Filers have in place policies and procedures to address any material conflicts of interest that may arise as a result of the dual registration of the Representative in the best interest of clients.
17. The Representative will be subject to supervision by, and the applicable compliance requirements of, both Filers.
18. QWealth has compliance and supervisory policies and procedures in place to monitor the conduct of its representatives, including the Representative, and to ensure QWealth addresses any material conflicts of interest in the best interest of clients.
19. QWealth will supervise the activities that the Representative will conduct on behalf of Polaris in the same way that it does other outside activities of its registered individuals, including by holding meetings regularly with him and obtaining regular status reports from him.
20. The relationship between the Filers and the fact that the Representative is dually registered with both Filers will be fully disclosed in writing to clients and prospective clients of each Filer that deal with the Representative.
21. In the absence of the Exemption Sought, the Filers would be prohibited under paragraphs 4.1(1)(a) and 4.1(1)(b) of NI 31-103 from permitting the Representative to be registered as an advising representative, director and officer of Polaris and an advising representative of QWealth.
22. The Representative will act in the best interest of all clients of each Filer and will deal fairly, honestly and in good faith with clients of each Filer.
The Decision Maker in respect of the Exemption Sought is satisfied that the decision meets the test set out in the Legislation.
The decision of the Decision Maker under the Legislation is that the Exemption Sought is granted provided that:
i) The Representative is subject to supervision by, and the applicable compliance requirements of, both Filers;
ii) The CCO and UDP of each Filer ensures that the Representative has sufficient time and resources to adequately service each Filer and its respective clients;
iii) The Filers each have adequate policies and procedures in place to address material conflicts of interest that may arise as a result of the dual registration of the Representative in the best interest of clients;
iv) The relationship between the Filers and the fact that the Representative is dually registered with both of them is fully disclosed in writing to clients and prospective clients of each of them that deal with the Representative; and
v) The Exemption Sought expires on the date on which the registration of Polaris is revoked.
OSC File #: 2023/0554
National Policy 11-203 Process for Exemptive Relief Applications in Multiple Jurisdictions -- Relief granted from short selling restrictions in NI 81-102 to permit an alternative mutual fund to short sell "government securities", as defined in NI 81-102, up to 300% of NAV -- relief sought in order to short securities in connection with fund's hedging strategy -- features of government bonds mitigate many of the risks associated with short selling strategies -- relief also granted to future alternative mutual funds managed by the Filer with similar short selling strategies.
National Instrument 81-102 Investment Funds, ss. 2.6.1, 2.6.2 and 19.1.
April 17, 2024
The principal regulator in the Jurisdiction has received an application from the Filer, on behalf of AGF Alternative Income Credit Fund (the New Fund) and any other alternative mutual funds established in the future and managed by the Filer or an affiliate of the Filer (each, a Future Fund and, together with the New Fund, the Funds), for a decision under the securities legislation of the principal regulator (the Legislation) exempting the Funds from the following provisions of National Instrument 81-102 Investment Funds (NI 81-102) in order to permit each Fund to short sell "government securities" (as that term is defined in NI 81-102) up to a maximum of 300% of a Fund's net asset value (NAV) (the Exemption Sought):
(a) subparagraph 2.6.1(1)(c)(v), which restricts a Fund from selling a security short if, at the time, the aggregate market value of the securities sold short by the Fund exceeds 50% of the Fund's NAV; and
(b) section 2.6.2 of NI 81-102, which states that a Fund may not borrow cash or sell securities short if, immediately after entering into a cash borrowing or short selling transaction, the aggregate value of cash borrowed combined with the aggregate market value of the securities sold short by the Fund would exceed 50% of the Fund's NAV
(together, the Short Selling Limits).
Under the Process for Exemptive Relief Applications in Multiple Jurisdictions (for a passport application):
(a) the Ontario Securities Commission is the principal regulator for the application; and
(b) the Filer has provided notice that subsection 4.7(1) of Multilateral Instrument 11-102 Passport System (MI 11-102) is intended to be relied upon in all of the provinces and territories of Canada other than the Jurisdiction (together with the Jurisdiction, the Jurisdictions).
Terms defined in National Instrument 14-101 Definitions, MI 11-102 and NI 81-102 have the same meaning if used in this decision, unless otherwise defined.
This decision is based on the following facts represented by the Filer:
The Filer
1. The Filer is a corporation amalgamated under the laws of the Province of Ontario with its head office located in Toronto, Ontario. The Filer is registered in the categories of (a) exempt market dealer in the Provinces of Alberta, British Columbia, Manitoba, Ontario, Quebec and Saskatchewan, (b) portfolio manager in each of the provinces and territories of Canada, (c) investment fund manager in the Provinces of Alberta, British Columbia, Newfoundland and Labrador, Ontario and Quebec, (d) a mutual fund dealer in the Provinces of British Columbia, Ontario and Quebec and (e) a commodity trading manager in the Province of Ontario.
2. The Filer is not in default of securities legislation in any Jurisdiction.
The Funds
3. The New Fund will be an alternative mutual fund established as a trust under the laws of Ontario that will operate under the provisions of NI 81-102 applicable to alternative mutual funds. Each Future Fund will be an alternative mutual fund under NI 81-102.
4. The New Fund will be a reporting issuer in each Jurisdiction and its units will be qualified for distribution to the public in each Jurisdiction pursuant to a simplified prospectus. The Filer anticipates filing a preliminary simplified prospectus for the New Fund on or about May 2, 2024. Each Future Fund will be a reporting issuer in one or more Jurisdictions.
5. The investment objective of the New Fund will be to generate consistent, full-cycle positive total returns with an emphasis on capital preservation and low correlation to traditional fixed income and equity markets. The New Fund will be primarily invested in investment grade corporate and government fixed-income securities and instruments of issuers anywhere in the world.
Reasons for the Exemption Sought
6. An important investment strategy used by the New Fund will be to enter into long positions in corporate bonds while hedging the interest rate risk of those bonds by taking short positions in government bonds. The short positions in the government bonds can be achieved through short selling government bonds.
7. The Short Selling Limits would restrict the New Fund to short selling government securities to no more than 50% of the Fund's NAV. However, NI 81-102 would permit the New Fund to obtain the additional leveraged short exposure through the use of specified derivatives, up to an aggregate exposure of 300% of the Fund's NAV.
8. The Filer is of the view, however, that it would be in the New Fund's best interest to permit it to physically short sell government securities up to 300% of the New Fund's NAV, instead of being limited to achieve the same degree of leverage through either specified derivatives only, or a combination of physical short selling and specified derivatives, for the following reasons:
(a) While derivatives can be used to create similar investment exposure as short selling up to 300% of the New Fund's NAV, the use of derivatives is more complex, more expensive and riskier than short selling. Implementing derivatives necessitates incremental transactional steps and expense to the New Fund.
(b) There is a potential mismatch between the corporate bond and government security futures contract, which makes the use of derivatives less efficient than short selling government securities. The futures contract has standard terms set by the exchange on which it trades and is not directly linked to one particular government security. This makes it more difficult to determine whether the interest rate exposure of the government security futures contract is a good match for the interest rate exposure of the corporate bond it is meant to hedge. On the other hand, the short position in a government security that the market pairs with a corporate bond has been selected due to its proven effectiveness in hedging the interest rate exposure of the corresponding corporate bond.
9. The Future Funds will employ an investment strategy similar to the New Fund's investment strategy in that each Future Fund will contemplate short selling government securities concurrently with investing in long positions in corporate fixed-income securities.
10. The only securities sold short by the Funds in excess of 50% of a Fund's NAV will be "government securities" as such term is defined in NI 81-102. The Funds will otherwise comply with the provisions governing short selling by an alternative mutual fund under sections 2.6.1 and 2.6.2 of NI 81-102.
11. Each Fund's aggregate exposure to short selling, cash borrowing and specified derivatives transactions will not exceed 300% of the Fund's NAV, in compliance with subsection 2.9.1 of NI 81-102 (the Aggregate Exposure Limit).
12. Each Fund will implement the following controls when conducting a short sale:
(a) The Fund will assume the obligation to return to the Borrowing Agent (as that term is defined in NI 81-102) the securities borrowed to effect the short sale;
(b) The Fund will receive cash for the securities sold short within normal trading settlement periods for the market in which the short sale is effected;
(c) The Filer will monitor the short positions of the Fund at least as frequently as daily;
(d) The security interest provided by the Fund over any of its assets that is required to enable the Fund to effect a short sale transaction is made in accordance with section 6.8.1 of NI 81-102 and will otherwise be made in accordance with industry practice for that type of transaction and relates only to obligations arising under such short sale transaction;
(e) The Fund will maintain appropriate internal controls regarding short sales, including written policies and procedures for the conduct of short sales, risk management controls and proper books and records; and
(f) The Filer and the Fund will keep proper books and records of short sales and all of its assets deposited with Borrowing Agents as security.
13. Each Fund's prospectus (the Prospectus) will contain adequate disclosure of the Fund's short selling activities, including material terms of the Exemption Sought.
The principal regulator is satisfied that the decision meets the test set out in the Legislation for the principal regulator to make the decision.
The decision of the principal regulator under the Legislation is that the Exemption Sought is granted, provided that:
1. The only securities which a Fund will sell short in an amount that exceeds 50% of the Fund's NAV will be securities that meet the definition of "government security" as such term is defined in NI 81-102.
2. Each short sale by a Fund will comply with all of the short sale requirements applicable to alternative mutual funds in sections 2.6.1 and 2.6.2 of NI 81-102.
3. A Fund's aggregate exposure to short selling, cash borrowing and specified derivatives will not exceed the Aggregate Exposure Limit.
4. Each short sale will be made consistent with the Fund's investment objectives and investment strategies.
5. The Fund's Prospectus will disclose that the Fund is able to short sell "government securities" (as that term is defined in NI 81-102) in an amount up to 300% of the Fund's NAV, including the material terms of this decision.
Application File #: 2024/0141
SEDAR+ File #: 6097734
Ninepoint Partners LP and Canadian Large Cap Leaders Split Corp.
National Policy 11-203 Process for Exemptive Relief Applications in Multiple Jurisdictions -- relief granted from qualification criteria in paragraph 2.2(d) of NI 44-101 to permit a fund that has not completed a financial year to use a short form prospectus under NI 44-101 or a shelf prospectus under NI 44-102 for subsequent offerings -- relief subject to conditions.
National Instrument 44-101 Short Form Prospectus, ss. 2.2(d) and 8.1.
April 1, 2024
The principal regulator in the Jurisdiction has received an application from the Filer on behalf of the Fund for a decision under the securities legislation of the Jurisdiction (the Legislation) granting an exemption to the Fund from paragraph 2.2(d) of National Instrument 44-101 Short Form Prospectus Distributions (NI 44-101) to permit the Fund to file a short form prospectus pursuant to NI 44-101 or a shelf prospectus pursuant to National Instrument 44-102 Shelf Distributions (NI 44-102) even though the Fund does not have current annual financial statements or a current AIF (the Exemption Sought).
Under the Process for Exemptive Relief Applications in Multiple Jurisdictions (for a passport application):
(a) the Ontario Securities Commission is the principal regulator for this application; and
(b) the Filer has provided notice that subsection 4.7(1) of Multilateral Instrument 11-102 Passport System (MI 11-102) is intended to be relied upon in each of the other provinces and territories of Canada (together with Ontario, the Jurisdictions).
Terms defined in National Instrument 14-101 Definitions, National Instrument 81-106 Investment Fund Continuous Disclosure (NI 81-106), MI 11-102, NI 44-101 or NI 44-102 have the same meaning if used in this decision, unless otherwise defined.
This decision is based on the following facts represented by the Filer:
1. The Filer is a limited partnership formed and organized under the laws of the Province of Ontario. The general partner of the Filer is Ninepoint Partners GP Inc., a corporation incorporated under the laws of the Province of Ontario. The head office of the Filer is located in Ontario.
2. The Filer is registered under the securities legislation: (i) in British Columbia, Alberta, Saskatchewan, Manitoba, Ontario, New Brunswick, Nova Scotia, and Newfoundland and Labrador as an adviser in the category of portfolio manager; (ii) in Ontario, Newfoundland and Labrador and Quebec as an investment fund manager; and (iii) in British Columbia, Alberta, Quebec, Saskatchewan, Manitoba, Ontario, New Brunswick, Nova Scotia, and Newfoundland and Labrador as a dealer in the category of exempt market dealer. The Filer is also registered in Ontario as a commodity trading manager.
3. The Filer is the investment fund manager and portfolio manager of the Fund.
4. Neither the Filer nor the Fund is in default of securities legislation in any of the Jurisdictions.
5. The Fund is (i) a corporation incorporated under the Business Corporations Act (Ontario) and is a "mutual fund" as defined in the Legislation and (ii) a reporting issuer as defined in the securities legislation of each of the Jurisdictions.
6. The Fund was incorporated on December 19, 2023, and the Fund's financial year end is December 31.
7. The Fund is authorized to issue an unlimited number of class J shares (the Class J Shares), class A shares (the Class A Shares) and preferred shares (the Preferred Shares), respectively.
8. On January 29, 2024, the Fund filed a final long form prospectus with the securities regulatory authority in each of the provinces and territories of Canada in connection with the initial public offering of the Class A Shares and Preferred Shares (the IPO). The Fund became a reporting issuer in each of the Jurisdictions on January 30, 2024. The Fund completed the IPO on February 22, 2024 and the Fund commenced operations on that date.
9. Accordingly, the Fund has not completed its first financial year as a reporting issuer and since commencing operations and, therefore, the Fund (i) has no audited financial statements in respect of a period ending on a financial year end, and (ii) has no current AIF.
10. As of March 15, 2024, there were 100 Class J Shares, 1,850,633 Class A Shares and 1,850,633 Preferred Shares issued and outstanding. The Class A Shares and the Preferred Shares are listed on the Toronto Stock Exchange under the symbols "NPS" and "NPS.PR.A", respectively.
11. The Fund wishes to be in a position to file a short form prospectus in accordance with NI 44-101 or a shelf prospectus in accordance with NI 44-102 in order to expedite future offerings of additional Class A Shares and Preferred Shares to the public.
12. For the Fund, filing a short form prospectus in accordance with NI 44-101 or a shelf prospectus in accordance with NI 44-102 is an efficient, expedient and cost-effective alternative to filing a long form prospectus in accordance with National Instrument 41-101 General Prospectus Requirements (NI 41-101).
13. Absent the Exemption Sought, the Fund would be required to file a long form prospectus in accordance with NI 41-101 and Form 41-101F2 as the Fund has yet to complete a financial year end as a reporting issuer and since commencing operations and therefore does not have current annual financial statements.
14. The Fund intends to file, in accordance with NI 81-106, audited annual financial statements of the Fund for the year ended December 31, 2024 (the 2024 Annual Financial Statements), prepared in accordance with Canadian GAAP applicable to publicly accountable enterprises.
15. The Fund intends to file, in accordance with NI 81-106, unaudited interim financial statements of the Fund for the period ended June 30, 2024 (the 2024 Interim Financial Statements), prepared in accordance with Canadian GAAP applicable to publicly accountable enterprises.
16. In the event that the Fund wishes to file a short form prospectus in accordance with NI 44-101 or a shelf prospectus in accordance with NI 44-102 prior to filing the 2024 Annual Financial Statements, the Fund proposes to prepare, file and incorporate by reference into such prospectus:
(a) audited financial statements presenting the financial results of the Fund for the period from February 22, 2024 to March 31, 2024, or, if March 31, 2024 is more than 90 days before the date of such prospectus, for the period from February 22, 2024 to a date after March 31, 2024 that is not more than 90 days before the date of such prospectus, prepared in accordance with Canadian GAAP applicable to publicly accountable enterprises (the Initial Financial Statements);
(b) a management report of fund performance for the period covered by the Initial Financial Statements; and
(c) if such prospectus is filed more than 60 days after June 30, 2024:
(i) the 2024 Interim Financial Statements; and
(ii) a management report of fund performance for the period covered by the 2024 Interim Financial Statements.
The principal regulator is satisfied that the decision meets the test set out in the Legislation for the principal regulator to make the decision.
The decision of the principal regulator under the Legislation is that the Exemption Sought is granted, provided that
(a) prior to filing a preliminary short form prospectus or shelf prospectus,
(i) the Fund files the Initial Financial Statements; and
(ii) the Fund files a management report of fund performance for the period covered by the Initial Financial Statements;
(b) in any short form prospectus or shelf prospectus filed by the Fund,
(i) the Fund includes or incorporates by reference the disclosure that would have been required in a current AIF, had the Fund been required to prepare a current AIF; and
(ii) the Fund includes disclosure regarding this decision in accordance with the requirements of section 19.1 of Form 44-101F1 Short Form Prospectus; and
(c) the Exemption Sought will expire on the earlier of
(i) the date upon which the Fund files the 2024 Annual Financial Statements; and
(ii) April 1, 2025.
Application File #: 2024/0129
SEDAR+ File #: 6097079
Application for time-limited relief from prospectus requirement and trade reporting requirements -- relief to allow the Filer to distribute Crypto Contracts to permitted clients -- relief revokes prior decision which was about to expire -- relief granted subject to certain conditions set out in the decision, including disclosure and reporting requirements -- relief is time-limited -- relief will expire upon two (2) years -- relief granted based on the particular facts and circumstances of the application with the objective of fostering innovative businesses in Canada -- decision should not be viewed as precedent for other filers.
Securities Act, R.S.O. 1990, c. S.5, as am., ss. 1(1), 53 and 74.
Multilateral Instrument 11-102 Passport System, s. 4.7.
OSC Rule 91-506 Derivatives: Product Determination, ss. 2 and 4.
OSC Rule 91-507 Trade Repositories and Derivatives Data Reporting, Part 3.
April 18, 2024
As set out in CSA Staff Notice 21-327 Guidance on the Application of Securities Legislation to Entities Facilitating the Trading of Crypto Assets (Staff Notice 21-327) and Joint CSA/Investment Industry Regulatory Organization of Canada Staff Notice 21-329 Guidance for Crypto Asset Trading Platforms: Compliance with Regulatory Requirements (Staff Notice 21-329), securities legislation applies to crypto asset trading platform (CTPs) that facilitate or propose to facilitate the trading of instruments or contracts involving anything commonly considered a crypto asset, digital or virtual currency, or digital or virtual token (a Crypto Asset) because the user's contractual right to the Crypto Asset may itself constitute a security and/or a derivative (a Crypto Contract). To foster innovation and respond to novel circumstances, the CSA has considered time-limited relief from certain securities law requirements that would allow CTPs to operate within a regulated environment, with regulatory requirements tailored to the CTP's operations. The overall goal of the regulatory framework is to ensure there is a balance between the need to be flexible and facilitate innovation in the Canadian capital markets, while upholding the regulatory mandate of promoting investor protection and fair and efficient capital markets.
The Filer is currently registered as an investment dealer and is a member of CIRO (as defined below). On November 16, 2021, the Filer obtained a time-limited decision (the 2021 Decision) that exempted the Filer from (i) the prospectus requirements under the securities legislation of the Jurisdiction (the Legislation) in respect of the Filer entering into Crypto Contracts with Clients (as defined below) to purchase, custody and sell Crypto Assets and (ii) certain reporting requirements under the Local Trade Reporting Rules (as defined below) in respect of Crypto Contracts. Subsequently, the 2021 Decision was revoked and replaced by the decision, In the Matter of Fidelity Clearing Canada ULC dated April 18, 2022 (the 2022 Decision) to allow the Filer to rely upon Additional Liquidity Providers (as defined below) for purposes of fulfilling its obligations under Crypto Contracts.
The Filer has submitted an application to extend its existing exemptive relief in order to continue entering into Crypto Contracts with Clients to purchase, custody, sell, deposit and withdraw Crypto Assets.
This decision (the Decision) has been tailored for the specific facts and circumstances of the Filer, and the securities regulatory authority or regulator in the Applicable Jurisdictions (as defined below) will not consider this Decision as constituting a precedent for other filers.
The securities regulatory authority or regulator in the Jurisdiction has received an application from the Filer (the Passport Application) for a decision under the Legislation to extend the time-limited exemption of the Filer from the prospectus requirements under the Legislation in respect of the Filer entering into Crypto Contracts with Clients to purchase, custody, sell, deposit and withdraw Crypto Assets (the Prospectus Relief).
The securities regulatory authority or regulator in the Jurisdiction and each of the other jurisdictions referred to in the definition of Local Trade Reporting Rules (the Coordinated Review Decision Makers) have received an application from the Filer (collectively with the Passport Application, the Application) for a decision under the securities legislation of those jurisdictions exempting the Filer from certain reporting requirements under the Local Trade Reporting Rules in respect of Crypto Contracts (the Trade Reporting Relief, and together with the Prospectus Relief, the Requested Relief).
The Filer has applied for the revocation and replacement of the exemptive relief in the 2022 Decision effective as of the date of this Decision.
Under the Process for Exemptive Relief Applications in Multiple Jurisdictions (for a hybrid application):
(a) the Ontario Securities Commission is the principal regulator (the Principal Regulator) for the Application;
(b) the Filer has provided notice that, in the jurisdictions where required, section 4.7(1) of Multilateral Instrument 11-102 Passport System (MI 11-102) is intended to be relied upon in each of the other provinces and territories of Canada (the Non-Principal Jurisdictions, together with Ontario, the Applicable Jurisdictions) in respect of the Prospectus Relief; and
(c) the decision in respect of the Trade Reporting Relief is the decision of the Principal Regulator and evidences the decision of each Coordinated Review Decision Maker.
Terms defined in National Instrument 14-101 Definitions and MI 11-102 have the same meaning if used in this Decision, unless otherwise defined. In addition to the terms defined above, the following terms shall have the following meanings:
Act means the Securities Act (Ontario).
Acceptable Third-party Custodian means an entity that:
(i) is one of the following:
1. a Canadian custodian or Canadian financial institution, as those terms are defined in NI 31-103;
2. a custodian qualified to act as a custodian or sub-custodian for assets held in Canada pursuant to section 6.2 [Entities Qualified to Act as Custodian or Sub-Custodian for Assets Held in Canada] of National Instrument 81-102 Investment Funds;
3. a custodian that meets the definition of an "acceptable securities location" in accordance with the Investment Dealer and Partially Consolidated Rules and Form 1 of CIRO;
4. a foreign custodian (as defined in NI 31-103) for which the Filer has obtained the prior written consent from the Principal Regulator and the regulator or securities regulatory authority of the Applicable Jurisdiction(s); or
5. an entity that does not meet the criteria for a qualified custodian (as defined in NI 31-103) and for which the Filer has obtained the prior written consent from the Principal Regulator and the regulator or securities regulatory authority of the Applicable Jurisdiction(s);
(ii) is functionally independent of the Filer within the meaning of NI 31-103;
(iii) has obtained audited financial statements within the last twelve months which
1. are audited by a person or company that is authorized to sign an auditor's report under the laws of a jurisdiction of Canada or a foreign jurisdiction and that meets the professional standards of that jurisdiction;
2. are accompanied by an auditor's report that expresses an unqualified opinion, and
3. unless otherwise agreed to by the Principal Regulator, discloses on their statement of financial position or in the notes of the audited financial statements the amount of liabilities that it owes to its clients for holding their assets, and the amount of assets held by the custodian to meet its obligations to those custody clients, broken down by asset; and
(iv) has obtained a Systems and Organization Controls (SOC) 2 Type 1 or SOC 2 Type 2 report within the last twelve months or has obtained a comparable report recognized by a similar accreditation board satisfactory to the Principal Regulator and the regulator or securities regulatory authority of the Applicable Jurisdiction(s);
Additional Liquidity Providers means a crypto asset trading firm or marketplace that the Filer will use, other than FDAS.
CIRO means Canadian Investment Regulatory Organization.
CSA means Canadian Securities Administrators.
Clients means the clients described in representation 6.
Crypto Asset Statement means the statement described in representations 13(v) and 16.
FCC Digital Assets Custody Account means the portion of FDAS' books and records system that records the amount of Crypto Assets held by FDAS in the name of the Filer on behalf of the Filer's Clients.
FCC Service means the two services that the Filer offers to Clients: the custody of Clients' Crypto Assets and the ability to enter into Crypto Contracts with the Filer to purchase and sell Crypto Assets, which services include the delivery by the Filer to Clients of Crypto Asset account statements and trade confirmations in compliance with CIRO rules.
FCC Sub-Account means the portion of the FDAS Bank Account that is segregated on FDAS' books and records in the name of the Filer.
FDAS means Fidelity Digital Asset Services, LLC.
FDAS Bank Account means the omnibus bank account at a depository institution in the name of FDAS, for the benefit of the FDAS' clients, holding FDAS' clients' cash.
FDAS Custody Service means the service provided by FDAS comprised of the custody of Crypto Assets for its clients.
FDAS Wallets means the FDAS omnibus digital wallets holding FDAS clients' Crypto Assets.
Local Trade Reporting Rules means: (i) Part 3, Data Reporting of Ontario Securities Commission Rule 91-507 Trade Repositories and Derivatives Data Reporting; (ii) Part 3, Data Reporting of Manitoba Securities Commission Rule 91-507 Trade Repositories and Derivatives Data Reporting; and (iii) Part 3, Data Reporting of Multilateral Instrument 96-101 Trade Repositories and Derivatives Data Reporting in Alberta, British Columbia, New Brunswick, Newfoundland and Labrador, Northwest Territories, Nova Scotia, Nunavut, Prince Edward Island, Saskatchewan, and Yukon.
NI 31-103 means National Instrument 31-103 Registration Requirements, Exemptions and Ongoing Registrant Obligations.
Risk Statement means a statement of risks as described in representation 13.
Specified Foreign Jurisdiction means any of the following: Australia, Brazil, any member country of the European Union, Hong Kong, Japan, the Republic of Korea, New Zealand, Singapore, Switzerland, the United Kingdom of Great Britain and Northern Ireland, the United States of America, and any other jurisdiction that the Principal Regulator may advise.
Value-Referenced Crypto Asset means a Crypto Asset that is designed to maintain a stable value over time by referencing the value of a fiat currency or any other value or right, or combination thereof.
This Decision is based on the following facts represented by the Filer:
1. The Filer is registered as an investment dealer in each of the provinces and territories of Canada, a futures commission merchant in Ontario, a dealer (futures commission merchant) in Manitoba and a derivatives dealer in Québec. As an investment dealer, the Filer is a member of CIRO. The Filer is also approved by CIRO to act as a carrying broker.
2. FDAS is a limited liability trust company organized under New York law authorized pursuant to Section 102-a of the New York Banking Law to engage in all activities described in Sections 96 and 100 of the New York Banking Law, with the exception of accepting deposits and making loans (other than pursuant to the exercise of its fiduciary powers). FDAS provides custody and trade execution services for digital assets. As a New York State-chartered trust company, FDAS is regulated by the New York State Department of Financial Services. In addition, FDAS is registered as a "money services business" with Financial Crimes Enforcement Network, a bureau of the U.S. Department of the Treasury. FDAS is not registered in any capacity in Canada.
3. Both the Filer and FDAS are part of the Fidelity group of companies known globally as Fidelity Investments®. The Filer is a client of FDAS and is the only Canadian client of FDAS. FDAS has other non-Canadian clients.
4. The Filer is not in default of securities legislation of any jurisdiction of Canada.
5. The Filer offers Clients the FCC Service, which consists of two services: the custody of the Clients' Crypto Assets and the ability of Clients to enter into Crypto Contracts with the Filer to buy and sell Crypto Assets.
6. The Filer offers the FCC Service to Clients who are: (i) CIRO member investment dealers for whom the Filer acts as carrying broker (Introducing Brokers); (ii) financial institutions, pension plans, governmental entities, corporations, trusts and partnerships; and (iii) portfolio managers acting on behalf of managed accounts. Each Client is (i) an Institutional Client (as defined under the CIRO rules) and (ii) a Permitted Client (as defined in NI 31-103).
7. A Crypto Contract is a bilateral contract or arrangement between a Client and the Filer. Accordingly, the Filer is the counterparty to each buy or sell transaction initiated by a Client. To fulfil its obligations under each Crypto Contract, the Filer, in turn, is currently a counterparty to a corresponding buy or sell transaction through FDAS. However, given Client demand for the FCC Service, the Filer now would like the ability to be able to fulfil its obligations under Crypto Contracts with one or more Additional Liquidity Providers. In connection with each Crypto Contract that involves a purchase by a Client, the Filer arranges for such applicable Crypto Assets to be custodied by FDAS.
8. All trading by Clients with the Filer in Crypto Contracts is done on a suitability exempt basis in accordance with CIRO rules.
9. The Filer's trading of Crypto Contracts is consistent with activities described in Staff Notice 21-327 and constitutes the trading of securities and/or derivatives.
10. The Filer does not hold any proprietary position in Crypto Assets for itself other than in connection with the Crypto Contracts; it does not take a long or short position in a Crypto Asset with any party, including Clients.
11. The Filer does not have any authority to act on a discretionary basis on behalf of Clients and does not, and will not, manage any discretionary accounts.
12. In addition to any other agreement that a Client may have with the Filer, each Client that accesses the FCC Service has a written agreement with the Filer that provides, among other things, that the Filer custodies the cash and Crypto Assets of the Client deposited with the Filer. This agreement clearly states that with respect to the custody of any Crypto Asset, the Filer has retained FDAS as a foreign custodian. The agreement further provides that a Client may enter into Crypto Contracts to purchase and/or sell Crypto Assets from or to the Filer through the FCC Service. For these services, the Filer charges Clients a fee based on the amount of Crypto Assets held and a transaction fee for each Crypto Contract to purchase or sell Crypto Assets. The Filer may also charge other fees related to the crypto business. All fees for the FCC Service are agreed to with each Client.
13. The agreement with the Client includes a Risk Statement that clearly explains, in plain language:
(i) the Crypto Contracts;
(ii) the risks associated with the Crypto Contracts;
(iii) prominently, that no securities regulatory authority or regulator in Canada has assessed or endorsed the Crypto Contracts or any of the Crypto Assets made available through the FCC Service;
(iv) the due diligence performed by the Filer before making a Crypto Asset available through the FCC Service, including the due diligence taken by the Filer to assess whether the Crypto Asset is a security and/or derivative under the securities and derivatives laws of each of the jurisdictions of Canada and the jurisdiction with which the Crypto Asset has the most significant connection, and the risks if the Filer has incorrectly determined that the Crypto Asset is not a security and/or derivative;
(v) that the Filer has prepared a plain language description of each Crypto Asset made available through the FCC Service, with instructions as to where the Client may obtain the descriptions (a Crypto Asset Statement);
(vi) the Filer's policies for halting, suspending and withdrawing a Crypto Asset from trading through the FCC Service, including criteria that would be considered by the Filer, options available to Clients holding such a Crypto Asset, any notification periods and any risks to Clients;
(vii) the location and manner in which Crypto Assets are held for the Client, and the risks and benefits to the Client of the Crypto Assets being held in that location and manner, including the impact of insolvency of the Filer or the custodian;
(viii) the manner in which the Crypto Assets are accessible by the Filer, and the risks and benefits to the Client arising from the Filer having access to the Crypto Assets in that manner;
(ix) that the Filer is a member of the Canadian Investor Protection Fund (CIPF), but the Crypto Contracts and the Crypto Assets held by the Filer (directly or indirectly) do not qualify for CIPF protection;
(x) a statement that the statutory rights in section 130.1 of the Act, and, if applicable, similar statutory rights under securities legislation of other Applicable Jurisdictions, do not apply in respect of the Risk Statement or a Crypto Asset Statement to the extent a Crypto Contract is distributed under the Prospectus Relief in this Decision; and
(xi) the date on which the information was last updated.
14. Each Client is required to acknowledge that the Client has received, read and understood the Risk Statement before opening an account with the Filer for Crypto Contracts. Such acknowledgement is prominent and separate from other acknowledgements provided by the prospective Client as part of the account opening process. A copy of the Risk Statement acknowledged by a Client and each Crypto Asset Statement delivered in the manner contemplated below to a Client is made available to the Client in the same place as the Client's other statements.
15. Before a Client enters into a Crypto Contract to buy a Crypto Asset for the first time, the Filer provides instructions for the Client to read the Crypto Asset Statement for the Crypto Asset, which includes a link to the Crypto Asset Statement on the Filer's website.
16. Each Crypto Asset Statement includes:
(i) a prominent statement that no securities regulatory authority or regulator in Canada has assessed or endorsed the Crypto Contracts or any of the Crypto Assets made available through the FCC Service;
(ii) a description of the Crypto Asset, including the background of the creation of the Crypto Asset, including the background of the developer(s) that first created the Crypto Asset, if applicable;
(iii) a description of the due diligence performed by the Filer with respect to the Crypto Asset;
(iv) any risks specific to the Crypto Asset;
(v) a direction to the Client to review the Risk Statement for additional discussion of general risks associated with the Crypto Contracts and Crypto Assets made available through the FCC Service;
(vi) a statement that the statutory rights in section 130.1 of the Act, and, if applicable, similar statutory rights under securities legislation of other Applicable Jurisdictions, do not apply in respect of the Crypto Asset Statement to the extent a Crypto Contract is distributed under the Prospectus Relief in this Decision; and
(vii) the date on which the information was last updated.
17. The Filer has policies and procedures for updating the Risk Statement and each Crypto Asset Statement to reflect any material change to the disclosure or include any material risk that may develop with respect to the Crypto Contracts, Crypto Assets generally, or a specific Crypto Asset, as the case may be. In the event the Risk Statement is updated, Clients will be promptly notified and provided with a copy of the updated Risk Statement. In the event a Crypto Asset Statement is updated, existing Clients of the Filer with Crypto Contracts in respect of that Crypto Asset will be promptly notified, with links provided to the updated Crypto Asset Statement.
18. The Filer does not maintain its own hot or cold storage for Crypto Assets. The Filer has retained FDAS as a foreign custodian in respect of the custody of Crypto Assets and in order to execute some of the trades with the Filer that relate to the Filer's obligations regarding the purchase and sale of Crypto Assets pursuant to the Crypto Contracts. In that regard, the Filer has entered into a services agreement with FDAS for, among other things, the FDAS Custody Service. While FDAS provides services to the Filer, FDAS has no contractual relationship with the Clients and the only direct interaction that FDAS has with the Clients relates solely to the actual transfer of Crypto Assets for custody purposes, as described below. The Filer is responsible for all applicable "know your client" account opening requirements and the Proceeds of Crime (Money Laundering) and Terrorist Financing Act and its regulations.
19. The Filer has verified that FDAS is appropriately registered and/or licensed to trade in the Crypto Assets in its home jurisdiction and that it is not in default of securities and banking legislation in any Applicable Jurisdiction.
20. In addition to FDAS, the Filer relies upon Additional Liquidity Providers to execute some of the trades with the Filer that relate to the Filer's obligations regarding the purchase and sale of Crypto Assets pursuant to the Crypto Contracts. None of these Additional Liquidity Providers will be affiliated or associated with the Filer or FDAS. All Crypto Assets purchased by the Filer from these Additional Liquidity Providers will be delivered immediately into the FDAS Wallet in the name of the Filer that custodies the Crypto Assets held by the Filer on behalf of Clients.
21. The Filer has taken reasonable steps to verify that each Additional Liquidity Provider is appropriately registered and/or licensed to trade in the Crypto Assets in its home jurisdiction, or that its activities do not require registration in its home jurisdiction, and that it is not in default of securities legislation in any Applicable Jurisdiction.
22. Currently, Clients are not able to negotiate the price of the Crypto Assets. However, the Filer will evaluate the price obtained from FDAS and each Additional Liquidity Provider on an ongoing basis. The Filer is subject to and will remain in compliance with the best execution obligations under CIRO rules, which, for greater certainty, require fair pricing.
23. The Filer has verified that FDAS and each Additional Liquidity Provider has effective policies and procedures to address concerns relating to fair price, fraud and market manipulation in connection with its trading activities in Crypto Assets.
24. The Filer has established and applies policies and procedures to review Crypto Assets and to determine whether to allow Clients to enter into Crypto Contracts to buy and sell the Crypto Asset through the FCC Service. Such review includes, but is not limited to:
(i) the creation, governance, usage and design of the Crypto Asset, including the source code relating to the Crypto Asset, the security protocols connected to the Crypto Asset, any plan for growth in the developer community that is connected to the Crypto Assets and, if applicable, the background of the developer(s) that created the Crypto Asset;
(ii) the supply, demand, maturity, utility and liquidity of the Crypto Asset;
(iii) material technical risks associated with the Crypto Asset, including any code defects, security breaches and other threats concerning the Crypto Asset and its supporting blockchain (such as the susceptibility to hacking and impact of forking), or the practices and protocols that apply to them; and
(iv) legal and regulatory risks associated with the Crypto Asset, including any pending, potential, or prior civil, regulatory, criminal, or enforcement action relating to the issuance, distribution, or use of the Crypto Asset.
25. The Filer only offers and allows Clients to enter into Crypto Contracts to buy and sell Crypto Assets that are not each themselves a security and/or a derivative. The Filer does not allow Clients to enter into Crypto Contracts in respect of Value-Referenced Crypto Assets.
26. The Filer is not engaged, and will not engage, in trades that are part of, or designed to facilitate, the creation, issuance or distribution of Crypto Assets by the developer(s) of the Crypto Asset or affiliates or associates of such person.
27. The Filer has established and applies policies and procedures to determine whether a Crypto Asset is a security and/or a derivative and is being offered in compliance with securities laws, which include, but are not limited to:
(i) consideration of statements made by any regulators or securities regulatory authorities of the Applicable Jurisdictions, other regulators in IOSCO-member jurisdictions, or the regulator with the most significant connection to a Crypto Asset about whether the Crypto Asset, or generally about whether the type of Crypto Asset, is a security and/or a derivative; and
(ii) if the Filer determines it to be necessary, obtaining legal advice as to whether the Crypto Asset is a security and/or derivative under Canadian securities legislation.
28. The Filer monitors ongoing developments related to the Crypto Assets available through the FCC Service that may cause a Crypto Asset's legal status or the assessment conducted by the Filer described in representations 24 and 27 above to change.
29. The Filer acknowledges that any determination made by the Filer as set out in representations 24 to 27 of this Decision does not prejudice the ability of the regulators or securities regulatory authorities of any province or territory of Canada to determine that a Crypto Asset that a Client may enter into a Crypto Contract to buy or sell is, in fact, a security or a derivative.
30. The Filer has established and applies policies and procedures to promptly stop the trading of any Crypto Asset available through the FCC Service, except to allow Clients to liquidate their positions in Crypto Contracts, with underlying Crypto Assets that the Filer ceases to make available through the FCC Service.
31. Under FDAS's purchase and sale execution and order fulfillment service, client trade orders are either (a) matched internally between clients of FDAS or (b) failing that, routed away and filled based on prices provided by FDAS' approved counterparties. FDAS attempts to provide its clients with the best price for trade orders that is available from its internal order books and its network of approved counterparties through its order handling process. For this purpose, "best price" means the highest available price for sell orders and the lowest available price for buy orders.
32. FDAS facilitates trade execution and settlement between its clients and its counterparties in the manner described in paragraph 33 below and by recording appropriate transfers between the FDAS Wallets and the FDAS Bank Account.
33. In fulfilling its trade execution and settlement services and to the extent that a trade order cannot be matched internally between clients, FDAS engages in riskless principal trading, insofar as it trades as principal with the applicable counterparty, and then immediately executes the offsetting trade with the applicable client. Each transaction of purchase and sale is fully settled, as FDAS does not currently permit the use of margin or leverage.
34. Each Additional Liquidity Provider also facilitates trade execution and settlement services in connection with Crypto Assets.
35. If a Client decides to enter into a Crypto Contract to buy Crypto Assets through the FCC Service, the Client enters into a Crypto Contract with the Filer for the purchase. The Filer itself, in turn, will obtain pricing data for the Crypto Assets from one or more of FDAS and the Additional Liquidity Providers, and will purchase the requested amount of Crypto Assets from FDAS or one of the Additional Liquidity Providers. The Filer then sells the Crypto Assets to the Client and deducts the amount of the purchase price, which includes all applicable transaction fees, from the Client's account. The Filer records the Client's purchase transaction in its books and records, for display back to the Client.
36. If a Client decides to enter into a Crypto Contract to sell some of the Client's Crypto Assets through the FCC Service, the Client enters into a Crypto Contract with the Filer for the sale. The Filer itself, in turn, will obtain pricing data for the Crypto Assets from one or more of FDAS and the Additional Liquidity Providers, and will sell the applicable amount of Crypto Assets to FDAS or one of the Additional Liquidity Providers. The Filer then purchases the requested amount of Crypto Assets from the Client, deducts any transaction fee and transfers the remaining cash proceeds, at the direction of the Client, to the Client's bank account or to the Client's custody account with the Filer. The Filer records the Client's sale transaction in its books and records, for display back to the Client.
37. The Filer maintains books and records that show, among other things, as at the end of each business day, the particulars of each trade that occurred during that business day. Clients have access to their own accounts and records in accordance with CIRO rules. The Filer and FDAS perform, and the Filer and the Additional Liquidity Providers will perform, reconciliations of all relevant accounts on each business day.
38. The Filer does not and will not extend margin, credit or other forms of leverage to Clients, and it does not and will not offer derivatives based on Crypto Assets to Clients other than Crypto Contracts.
39. FDAS acts as foreign custodian of the Crypto Assets, which are held in the FDAS Wallets. Other than the equity requirement, FDAS satisfies the criteria of a "qualified custodian" as defined in NI 31-103. The Filer has assessed whether FDAS meets the definition of an Acceptable Third-party Custodian.
40. The Crypto Assets held by FDAS for the Filer on behalf of the Filer's Clients are held by FDAS in the FDAS Wallets with the Crypto Assets owned by other custody clients of FDAS. FDAS' books and records system records the amount of Crypto Assets held by FDAS in the name of the Filer on behalf of the Filer's Clients, which record is referred to as the "FCC Digital Assets Custody Account".
41. If a Client decides to deposit Crypto Assets for custody, the Client contacts the Filer to request, and receive, deposit instructions. The Filer then requests the applicable deposit instruction from FDAS. FDAS generates the deposit instruction and communicates this instruction to the Filer, which the Filer then makes available to its Client. The Client then transfers the Crypto Assets from his, her or its existing digital asset account to the FDAS Wallets in accordance with the FDAS deposit instruction provided to the Client by the Filer. Upon appropriate confirmation of the deposit by FDAS, FDAS notifies the Filer of the updated balance in the FCC Digital Assets Custody Account, and the Filer records the Client's deposit transaction in its books and records, for display back to the Client.
42. If a Client decides to withdraw Crypto Assets from custody, the Client contacts the Filer to initiate a withdrawal transaction by indicating the type, quantity and destination instruction for the Crypto Assets. The Filer relays that information to FDAS to initiate a withdrawal transaction. FDAS promptly debits the Crypto Asset balance in the FCC Digital Assets Custody Account and processes the withdrawal transaction pursuant to the terms agreed to between FDAS and the Filer and in accordance with the instructions provided to the Filer by the Client and to FDAS by the Filer. FDAS provides transaction confirmation to the Filer and, in turn, the Filer reflects the Client's transaction on its books and records, for display back to the Client.
43. The Filer maintains books and records that show, among other things, as at the end of each business day, the allocation among its Clients of the Crypto Assets recorded in the FCC Digital Assets Custody Account and the amount of the Filer's cash held in the FCC Sub-Account. Clients have access to their own accounts and records in accordance with CIRO rules. The Filer and FDAS perform reconciliations of all relevant accounts on each business day.
44. FDAS has obtained SOC 1 Type 2 and SOC 2 Type 2 examination reports of its internal controls. The Filer has conducted due diligence on FDAS, including a review of the SOC 1 Type 2 and SOC 2 Type 2 examination reports, and has not identified any material concern.
45. The Filer and FDAS operate independently of each other and have different directors, officers and employees. The FDAS Custody Service is performed by FDAS's personnel, who are not employees, contractors, agents or officers of the Filer.
46. FDAS operates one or more custody accounts, or FDAS Wallets, for the purpose of holding FDAS clients' Crypto Assets. Pursuant to the services agreement between the Filer and FDAS, FDAS is not permitted to pledge, re-hypothecate or otherwise use any Crypto Assets held for the Filer in the course of its business.
47. FDAS has established and applies policies and procedures that manage and mitigate the custodial risks, including, but not limited to, an effective system of controls and supervision to safeguard the Crypto Assets for which it acts as custodian.
48. The Filer has assessed the risks and benefits of using FDAS and has determined that, in comparison to a Canadian custodian (as that term is defined in NI 31-103), it is more beneficial to use FDAS, a U.S. custodian.
49. FDAS currently maintains, or is insured under, professional liability insurance, with coverage for loss of digital assets, including the Crypto Assets held for the Filer.
50. The Filer does not operate a "marketplace" as that term is defined in National Instrument 21-101 Marketplace Operation and, in Ontario, subsection 1(1) of the Act.
51. The Filer does not operate a "clearing agency" or a "clearing house" as the terms are defined or referred to in securities or commodities futures legislation. Any clearing or settlement activity conducted by the Filer is incidental to the Filer engaging in the business of entering into Crypto Contracts with its Clients. Any activities of the Filer that may be considered the activities of a clearing agency or clearing house are related to the Filer arranging or providing for settlement of obligations resulting from agreements entered into on a bilateral basis and without a central counterparty.
The Principal Regulator is satisfied that the Decision satisfies the test set out in the Legislation for the Principal Regulator to make the Decision and each Coordinated Review Decision Maker is satisfied that the Decision in respect of the Trade Reporting Relief satisfies the test set out in the securities legislation of that jurisdiction for the Coordinated Review Decision Maker to make the Decision in respect of the Trade Reporting Relief.
The Decision of the Principal Regulator under the Legislation is that the 2022 Decision is revoked and the Requested Relief is granted, and the Decision of each Coordinated Review Decision Maker under the securities legislation of its jurisdiction is that the 2022 Decision is revoked and the Trade Reporting Relief is granted, provided that:
(a) with respect to Clients resident in an Applicable Jurisdiction, the Filer remains registered as a dealer in the category of investment dealer with the Principal Regulator and the securities regulators or securities regulatory authority in such Applicable Jurisdiction and a member of CIRO;
(b) all Crypto Contracts with Clients resident in the Applicable Jurisdictions are conducted pursuant to CIRO rules imposed on members seeking to trade in Crypto Contracts and in accordance with any acceptable practices established by CIRO, as amended from time to time;
(c) the Filer provides the FCC Services only to Clients as described in representation 6 and before offering the FCC Services to an Introducing Broker, the Filer takes reasonable steps to verify that the Introducing Broker has received the prior written approval of CIRO to offer Crypto Contracts to the Introducing Broker's clients;
(d) the Filer does not operate a "marketplace" as the term is defined in National Instrument 21-101 Marketplace Operation and, in Ontario, in subsection 1(1) of the Act or a "clearing agency" or "clearing house" as the terms are defined or referred to in securities or commodities futures legislation;
(e) except as set out in condition (f), at all times, the Filer retains FDAS as its foreign custodian and custodies all of its Clients' Crypto Assets with FDAS, and FDAS at all times will be an Acceptable Third-party Custodian;
(f) the Filer will promptly cease using FDAS as the custodian for the Crypto Assets of its Clients at any time that FDAS ceases to be regulated by the New York State Department of Financial Services as a New York State-chartered trust company, in which case:
(i) the Filer will hold the Crypto Assets of its Clients with a custodian that meets the definition of an Acceptable Third-party Custodian;
(ii) before the Filer holds Crypto Assets of its Clients with a custodian referred to in (i) above, the Filer will take reasonable steps to verify that the custodian:
(A) will hold the Crypto Assets for the Filer's clients (i) in an account clearly designated for the benefit of the Filer's clients or in trust for the Filer's clients, (ii) separate and apart from the assets of the custodian's other clients, and (iii) separate and apart from the custodian's own assets and from the assets of any custodial service provider;
(B) has appropriate insurance to cover the loss of Crypto Assets held at the custodian;
(C) has established and applies written policies and procedures that manage and mitigate the custodial risks, including, but not limited to, an effective system of controls and supervision to safeguard the Crypto Assets for which it acts as custodian; and
(D) meets each of the requirements to be an Acceptable Third-party Custodian, except for those criteria in respect of which the custodian does not meet and the Principal Regulator and the regulator or securities regulatory authority of the other Jurisdictions have provided prior written approval for use of the custodian.
(g) the Filer has taken reasonable steps to verify that FDAS:
(i) has appropriate insurance to cover the loss of Crypto Assets held by it; and
(ii) has established and applies written policies and procedures that manage and mitigate the custodial risks, including, but not limited to, an effective system of controls and supervision to safeguard the Crypto Assets for which it acts as custodian;
(h) the Filer will promptly notify the Principal Regulator if the U.S. Securities and Exchange Commission, the U.S. Commodity Futures Trading Commission, the Financial Industry Regulatory Authority, the National Futures Association, or the New York State Department of Financial Services makes a determination that the Filer's custodian for its Clients' Crypto Assets is not permitted by that regulatory authority to hold client Crypto Assets;
(i) the Filer will only use FDAS or an Additional Liquidity Provider if the Filer has verified it is registered and/or licensed, to the extent required in its home jurisdiction, to execute trades in the Crypto Assets and is not in default of securities legislation in any of the Applicable Jurisdictions, and will promptly stop using FDAS or an Additional Liquidity Provider if (i) the Filer is made aware that either FDAS or the Additional Liquidity Provider, as the case may be, is, or (ii) a court, regulator or securities regulatory authority in any jurisdiction of Canada has determined FDAS or the Additional Liquidity Provider, as the case may be, to be, not in compliance with securities legislation in any of the Applicable Jurisdictions;
(j) before a Client enters into his, her or its first Crypto Contract, the Filer delivers to the Client a Risk Statement and requires the Client to provide electronic or written acknowledgement of having received, read and understood the Risk Statement;
(k) the disclosure in condition (j) is prominent and separate from other disclosures given to the Client at that time, and the acknowledgement is separate from other acknowledgements by the Client at that time;
(l) a copy of the Risk Statement acknowledged by a Client is made available to the Client in the same place as the Client's other statements;
(m) before a Client enters into a Crypto Contract to buy a Crypto Asset for the first time, the Filer provides instructions for the Client to read the Crypto Asset Statement for the Crypto Asset, which includes a link to the Crypto Asset Statement and includes the information set out in representation 16;
(n) the Filer will promptly update the Risk Statement and each Crypto Asset Statement to reflect any material changes to the disclosure or to include any material risk that may develop with respect to the Crypto Contracts and/or Crypto Asset and:
(i) in the event of any update to the Risk Statement, will promptly notify each Client of the update and deliver to them a copy of the updated Risk Statement, and
(ii) in the event of any update to a Crypto Asset Statement, will promptly notify each Client through website disclosures, with links provided to the updated Crypto Asset Statement;
(o) prior to the Filer delivering a Risk Statement to a Client, the Filer will deliver, or will have previously delivered, a copy of the Risk Statement to the Principal Regulator;
(p) in each Applicable Jurisdiction, the first trade of a Crypto Contract is deemed to be a distribution under the securities legislation of that jurisdiction;
(q) the Filer only trades Crypto Assets or Crypto Contracts based on Crypto Assets that are not in and of themselves securities or derivatives; for greater certainty, the Filer will not trade Value-Referenced Crypto Assets or Crypto Contracts based on Value-Referenced Crypto Assets;
(r) the Filer evaluates Crypto Assets as set out in representations 24 and 27;
(s) the Filer will not trade Crypto Assets or Crypto Contracts based on Crypto Assets with a client in a Jurisdiction, without the prior written consent of the regulator or securities regulatory authority of the Jurisdiction, where the Crypto Asset was issued by or on behalf of a person or company that is or has in the last five years been the subject of an order, judgment, decree, sanction, or administrative penalty imposed by, or has entered into a settlement agreement with, a government or government agency, administrative agency, self-regulatory organization or court in Canada or in a Specified Foreign Jurisdiction in relation to a claim based in whole or in part on fraud, theft, deceit, aiding and abetting or otherwise facilitating criminal activity, misrepresentation, violation of AML laws, conspiracy, breach of trust, breach of fiduciary duty, insider trading, unregistered trading, illegal distributions, failure to disclose material facts or changes, or allegations of similar conduct;
(t) except to allow Clients to liquidate their positions in those Crypto Contracts or transfer such Crypto Assets to a blockchain address specified by the Client, the Filer will promptly stop trading Crypto Contracts where the underlying is a Crypto Asset if (i) the Filer determines it to be, (ii) a court, regulator or securities regulatory authority in any jurisdiction of Canada or the foreign jurisdiction with which the Crypto Asset has the most significant connection determines it to be, or (iii) the Filer is made aware or is informed that the Crypto Asset is viewed by a regulator or securities regulatory authority to be, a security and/or derivative;
(u) the Filer is not engaged, and will not engage, in trades that are part of, or designed to facilitate, the creation, issuance or distribution of Crypto Assets by the developer(s) of the Crypto Asset or affiliates or associates of such person.
(v) the Filer will provide the Principal Regulator with at least 10 days' prior written notice of any:
(i) change of or use of a new custodian; and
(ii) material changes to the Filer's ownership, its business operations, including its systems, or its business model;
(w) the Filer will notify the Principal Regulator, promptly, of any material breach or failure in the provision of the FCC Service, including any material cybersecurity breach of FDAS's or other custodian's systems of controls or supervision that impact the Crypto Assets of a Client held by the custodian, and what steps have been taken by the Filer to address each such breach or failure. The loss of any amount of Crypto Assets in the FCC Digital Asset Custody Account will be considered a material breach or failure in the provision of the FCC Service;
(x) the Filer will deliver the reporting as set out in Appendix A;
(y) in addition to any other reporting required by Legislation, the Filer will provide, on a timely basis, any report, data, document or information about the FCC Service to the Principal Regulator, including any information about the Filer's custodian and the Crypto Assets held by the Filer's custodian, that may be requested by the Principal Regulator from time to time as reasonably necessary for the purpose of monitoring compliance with the Legislation and the conditions in this Decision, in a format acceptable to the Principal Regulator;
(z) upon request, the Filer will provide the Principal Regulator and the regulators or securities regulatory authorities of each of the Non-Principal Jurisdictions with aggregated and/or anonymized data concerning Client demographics and activity that may be useful to advance the development of the Canadian regulatory framework for trading Crypto Assets;
(aa) the Filer will promptly make any change to its business practices or policies and procedures that may be required to address investor protection concerns that may be identified by the Filer or by the Principal Regulator, in consultation with CIRO, arising from the FCC Services;
(bb) this Decision may be amended by the Principal Regulator upon prior written notice to the Filer in accordance with applicable securities legislation; and
(cc) this Decision shall expire two years from the date of this Decision.
In respect of the Prospectus Relief:
Dated: April 11, 2024
In respect of the Trade Reporting Relief:
Dated: April 18, 2024
Application File #: 2024/0145
1. Commencing with the quarter ending June 30, 2024, the Filer will deliver the following information to the Principal Regulator and each of the Coordinated Review Decision Makers in an agreed form and manner specified by the Principal Regulator and each of the Coordinated Review Decision Makers, with respect to Clients residing in the Jurisdiction of such Coordinated Review Decision Maker, within 30 days of the end of each March, June, September and December:
a. aggregate reporting of activity conducted pursuant to the FCC Service that will include the following:
i. number of Client accounts opened each month in the quarter;
ii. number of Client accounts frozen or closed each month in the quarter;
iii. number of trades in each month in the quarter;
iv. average value of the trades in each month in the quarter;
v. number of Client accounts at the end of each month in the quarter;
vi. number of Client accounts with no trades during the quarter;
vii. number of Client accounts that have not been funded at the end of each month in the quarter; and
viii. number of Client accounts that hold a positive amount of Crypto Assets at end of each month in the quarter;
b. the details of any Client complaints received by the Filer during the calendar quarter and how such complaints were addressed;
c. the details of any fraudulent activity or cybersecurity incidents during the calendar quarter, any resulting harm and effect on Clients, and the corrective measures taken by the Filer to remediate such activity or incident and prevent similar activities or incidents from occurring in the future; and
d. the details of the transaction volume per FDAS and each Additional Liquidity Provider, per Crypto Asset during the quarter.
2. The Filer will deliver to the Principal Regulator and each of the Coordinated Review Decision Makers, in an agreed form and manner specified by the Principal Regulator and each of the Coordinated Review Decision Makers, a report that includes the anonymized account-level data for the FCC Services for each Client residing in the Jurisdiction of such Coordinated Review Decision Maker, within 30 days of the end of each March, June, September and December for data elements outlined in Appendix B.
Number |
Data Element Name |
Definition for Data Element{1} |
Format |
Values |
Example |
|
|||||
Data Elements Related to each Unique Client |
|||||
|
|||||
1 |
Unique Client Identifier |
Alphanumeric code that uniquely identifies a customer. |
Varchar(72) |
An internal client identifier code assigned by the CTP to the client. The identifier must be unique to the client. |
ABC1234 |
|
|||||
2 |
Unique Account Identifier |
Alphanumeric code that uniquely identifies an account. |
Varchar(72) |
A unique internal identifier code which pertains to the customer's account. There may be more than one Unique Account Identifier linked to a Unique Client Identifier. |
ABC1234 |
|
|||||
3 |
Jurisdiction |
The Province or Territory where the client, head office or principal place of business is, or under which laws the client is organized, or if an individual, their principal place of residence. |
Varchar(5) |
Jurisdiction where the client is located using ISO 3166-2 --- See the following link for more details on the ISO standard for Canadian jurisdictions codes. https://www.iso.org/obp/ui/#iso:code:3166:CA |
CA-ON |
|
|||||
Data Elements Related to each Unique Account |
|||||
|
|||||
4 |
Account Open Date |
Date the account was opened and approved to trade. |
YYYY-MM-DD, based on UTC. |
Any valid date based on ISO 8601 date format. |
2022-10-27 |
|
|||||
5 |
Cumulative Realized Gains/Losses |
Cumulative Realized Gains/Losses from purchases, sales, deposits, withdrawals and transfers in and out, since the account was opened as of the end of the reporting period. |
Num(25,0) |
Any value rounded to the nearest dollar in CAD. Use the market value at the time of transfers in, transfers out, deposits and withdrawals of the Digital Token to determine the cost basis or the realized gain or loss. |
205333 |
|
|||||
6 |
Unrealized Gains/Losses |
Unrealized Gains/Losses from purchases, deposits and transfers in as of the end of the reporting period. |
Num(25,0) |
Any value rounded to the nearest dollar in CAD. Use the market value at the time of transfers in or deposits of the Digital Token to determine the cost basis. |
-30944 |
|
|||||
7 |
Digital Token Identifier |
Alphanumeric code that uniquely identifies the Digital Token held in the account. |
Char(9) |
Digital Token Identifier as defined by ISO 24165. See the following link for more details on the ISO standard for Digital Token Identifiers. https://dtif.org/ |
4H95J0R2X |
|
|||||
Data Elements Related to each Digital Token Identifier Held in each Account |
|||||
|
|||||
8 |
Quantity Bought |
Number of units of the Digital Token bought in the account during the reporting period. |
Num(31,18) |
Any value greater than or equal to zero up to a maximum number of 18 decimal places. |
4358.326 |
|
|||||
9 |
Number of Buy Transactions |
Number of transactions associated with the Quantity Bought during the reporting period. |
Num(25,0) |
Any value greater than or equal to zero. |
400 |
|
|||||
10 |
Quantity Sold |
Number of units of the Digital Token sold in the account during the reporting period. |
Num(31,18) |
Any value greater than or equal to zero up to a maximum number of 18 decimal places. |
125 |
|
|||||
11 |
Number of Sell Transactions |
Number of transactions associated with the Quantity Sold during the reporting period. |
Num(25,0) |
Any value greater than or equal to zero. |
3325 |
|
|||||
12 |
Quantity Transferred In |
Number of units of the Digital Token transferred into the account during the reporting period. |
Num(31,18) |
Any value greater than or equal to zero up to a maximum number of 18 decimal places. |
10.928606 |
|
|||||
13 |
Number of Transactions from Transfers In |
Number of transactions associated with the quantity transferred into the account during the reporting period. |
Num(25,0) |
Any value greater than or equal to zero. |
3 |
|
|||||
14 |
Quantity Transferred Out |
Number of units of the Digital Token transferred out of the account during the reporting period. |
Num(31,18) |
Any value greater than or equal to zero up to a maximum number of 18 decimal places. |
603 |
|
|||||
15 |
Number of Transactions from Transfers Out |
Number of transactions associated with the quantity transferred out of the account during the reporting period. |
Num(25,0) |
Any value greater than or equal to zero. |
45 |
|
|||||
16 |
Quantity Held |
Number of units of the Digital Token held in the account as of the end of the reporting period. |
Num(31,18) |
Any value greater than or equal to zero up to a maximum number of 18 decimal places. |
3641.25461 |
|
|||||
17 |
Value of Digital Token Held |
Value of the Digital Token held as of the end of the reporting period. |
Num(25,0) |
Any value greater than or equal to zero rounded to the nearest dollar in CAD. Use the unit price of the Digital Token as of the last business day of the reporting period multiplied by the quantity held as reported in (16). |
45177788 |
|
|||||
18 |
Client Limit |
The Client Limit established on each account. |
Num(25,2) |
Any value greater than or equal to zero rounded to the nearest dollar in CAD, or if a percentage, in decimal format. |
0.50 |
|
|||||
19 |
Client Limit Type |
The type of limit as reported in (18). |
Char(3) |
AMT (amount) or PER (percent). |
PER |
{1} Note: Digital Token refers to either data associated with a Digital Token, or a Digital Token referenced in an investment contract.
National Policy 11-203 Process for Exemptive Relief Applications in Multiple Jurisdictions -- Existing and future investment funds granted an exemption from paragraphs 2.5(2)(a), 2.5(2)(a.1) and 2.5(2)(c) of NI 81-102 to invest up to 10% of net assets, in aggregate, in securities of SICAV Funds governed by the laws of Luxembourg and UCITS Funds governed by the Central Bank of Ireland -- Underlying foreign funds are subject to similar investment restrictions and disclosure requirements as top funds -- Relief granted subject to conditions -- National Instrument 81-102 Investment Funds.
National Instrument 81-102 Investment Funds, ss. 2.5(2)(a), 2.5(2)(a.1), 2.5(2)(c) and 19.1.
April 19, 2024
The principal regulator in the Jurisdiction has received an application from the Filer, on behalf of the Initial Top Funds (as defined below), and any existing and future investment funds that are or will be managed by the Filer or an affiliate or associate of the Filer (the Future Top Funds, and together with the Initial Top Funds, the Funds, and individually, a Fund), for a decision under the securities legislation of the principal regulator (the Legislation) exempting each Fund from the following clauses of National Instrument 81-102 Investment Funds (NI 81-102):
(a) 2.5(2)(a) and (a.1) to permit each Fund to purchase and/or hold securities of Underlying Funds, which are SICAV Funds and/or UCITS Funds (each as defined below) even though the Underlying Funds are not subject to NI 81-102; and
(b) 2.5(2)(c) to permit each Fund to purchase and/or hold securities of Underlying Funds even though the Underlying Funds are not reporting issuers in any province or territory of Canada (collectively, the Exemption Sought).
Under the Process for Exemptive Relief Applications in Multiple Jurisdictions (for a passport application):
(a) the Ontario Securities Commission is the principal regulator for this application, and
(b) the Filer has provided notice that subsection 4.7(1) of Multilateral Instrument 11-102 Passport System (MI 11-102) is intended to be relied upon by the Funds in each of the other provinces and territories of Canada (together with Ontario, the Jurisdictions).
Terms defined in MI 11-102, National Instrument 14-101 Definitions and NI 81-102 have the same meanings if used in this decision, unless otherwise defined. Additionally, the following terms have the following meanings:
Companies Act means the Companies Act 2014 (Ireland) as amended, all enactments which are to be read as one with, or construed or read together with, or as one with, the Companies Act 2014 (Ireland) and every statutory modification and re-enactment thereof for the time being in force.
CSSF means Commission de Surveillance du Secteur Financier.
EU Directives means EU Council Directive 2009/65/EC of 13 July 2009 on the Coordination of Laws, Regulations and Administrative Provisions relating to UCITS, as amended, including but not limited to, Commission Directive 2010/43/EC, Commission Directive 2010/44/EC, and Commission Directive 2014/91/EC.
Initial Top Funds means BMO Managed Balanced Portfolio, BMO Managed Conservative Portfolio, BMO Managed Equity Growth Portfolio, BMO Managed Growth Portfolio, BMO Managed Income Portfolio, BMO SelectTrust® Balanced Portfolio, BMO SelectTrust® Conservative Portfolio, BMO SelectTrust® Equity Growth Portfolio, BMO SelectTrust® Growth Portfolio, BMO SelectTrust® Income Portfolio and other investment funds managed by the Filer from time to time.
KIID means a Key Investor Information Document prepared by a UCITS Corporation for each of the Underlying Funds which contains disclosure similar to that required to be included in a fund facts document prepared under NI 81-101 or an ETF facts document prepared under NI 41-101.
NI 41-101 means National Instrument 41-101 General Prospectus Requirements.
NI 81-101 means National Instrument 81-101 Mutual Fund Prospectus Disclosure.
SICAV means Société d'Investissement à Capital Variable, an open-end company, governed by the laws of Luxembourg.
SICAV Funds means each of the existing sub-funds of an umbrella SICAV with UCITS status and other sub-funds of an umbrella SICAV with UCITS status established in the future.
UCITS means Undertaking for Collective Investments in Transferable Securities and refers to the investment funds authorized by the European Union as investment funds suitable to be distributed in more than one country in Europe.
UCITS Corporations means investment companies with variable capital, incorporated in Ireland pursuant to the Companies Act and the UCITS Regulations.
UCITS Funds means each of the existing sub-funds of the UCITS Corporations and other sub-funds of the UCITS Corporations established in the future under one of the UCITS Corporations.
UCITS Notices means the series of UCITS notices, memorandums, guidelines and letters issued by the Central Bank of Ireland or the CSSF, as the case may be.
UCITS Regulations means the regulations issued by European Union member states that implement the EU Directives.
Underlying Fund means a SICAV Fund or a UCITS Fund.
Underlying Fund Manager means the promoter, investment manager and distributor of an Underlying Fund.
This decision is based on the following facts represented by the Filer:
The Filer
1. The Filer is a corporation amalgamated under the laws of Canada. The Filer is an indirect, wholly-owned subsidiary of Bank of Montreal. The Filer's head office is located in Toronto, Ontario.
2. The Filer is registered as an investment fund manager (IFM) in each of Ontario, Québec and Newfoundland and Labrador, and as a mutual fund dealer in each of the Jurisdictions.
3. The Filer or an affiliate acts or will act as the IFM of the Funds.
4. The Filer is not in default of securities legislation in any of the Jurisdictions.
The Funds
5. Each Fund is, or will be, an investment fund organized and governed by the laws of Canada or a Jurisdiction.
6. Each Fund is, or will be, governed by the applicable provisions of NI 81-102, subject to any relief therefrom that have been, or may in the future be, granted by the securities regulatory authorities.
7. Each Fund is, or will be, a reporting issuer in one or more of the Jurisdictions.
8. The Initial Top Funds are not in default of applicable securities legislation in any Jurisdiction.
9. Each investment by a Fund in securities of an Underlying Fund will be made in accordance with the investment objectives of the Fund and will represent the business judgment of responsible persons uninfluenced by considerations other than the best interests of the Fund.
10. Subject to compliance with NI 81-102, the investment objectives and strategies of each Fund would permit the Fund to invest in securities of the Underlying Funds.
The Underlying Funds
11. A Fund may, from time to time, invest up to 10% of its net asset value in securities of an Underlying Fund.
12. The UCITS Funds are sub-funds of a UCITS Corporation and are subject to the UCITS Regulations.
13. The SICAV Funds are sub-funds of an umbrella SICAV with UCITS status under the laws of Luxembourg and are subject to UCITS Regulations.
14. The Underlying Funds are conventional mutual funds subject to investment restrictions and practices that are substantially similar to those applicable to the Funds. The Underlying Funds are available for purchase by the public and are generally not considered hedge funds. Each of the Underlying Funds is considered to be an "investment fund" and a "mutual fund" within the meaning of applicable Canadian securities legislation.
15. The Underlying Funds qualify as UCITS and the securities of the Underlying Funds are distributed in accordance with the UCITS Regulations. Each UCITS Fund is regulated by the Central Bank of Ireland and each SICAV Fund is regulated by the CSSF.
16. The Underlying Funds are qualified for purchase by way of a prospectus, relating to the UCITS Corporations and the umbrella SICAVs, and an individual prospectus supplement pertaining to each sub-fund of the UCITS Corporations and the umbrella SICAVs, including each of the Underlying Funds. In addition to the prospectus and prospectus supplement, the UCITS Corporations and the umbrella SICAVs prepare a KIID for each of the Underlying Funds.
17. An Underlying Fund Manager serves as the promoter, investment manager and distributor of each sub-fund of the UCITS Corporations and the umbrella SICAVs. An Underlying Fund Manager, subject to the supervision of the directors of the UCITS Corporations or the umbrella SICAV, as the case may be, is responsible for the investment management, distribution and marketing of the Underlying Funds. The Underlying Fund Manager provides an investment program for the Underlying Funds and manages the investment of the Underlying Funds' assets.
18. An Underlying Fund Manager, being subject to regulatory oversight by the Central Bank of Ireland or CSSF, is subject to substantially equivalent regulatory oversight as the Filer, which is principally regulated by the OSC. In discharging its duties, the Underlying Fund Manager must conduct its business with due skill, care and diligence.
19. The Underlying Funds are subject to the following regulatory requirements and restrictions pursuant to, and among others, the EU Directives, which are substantially similar to the requirements and restrictions set forth in NI 81-102:
(a) Each Underlying Fund is subject to a robust risk management framework through prescribed rules on governance, risk, regulation of service providers and safekeeping of assets.
(b) Each Underlying Fund is restricted to investing a maximum of 10% of its net assets in a single issuer.
(c) Each Underlying Fund is subject to investment restrictions designed to limit its holdings of illiquid securities to 10% or less of its net asset value.
(d) Each Underlying Fund is subject to investment restrictions designed to limit holdings of transferrable securities which are not listed on a stock exchange or regulated market to 10% or less of the Underlying Fund's net asset value.
(e) The rules governing the use of derivatives by the Underlying Funds are comparable to the rules regarding the use of derivatives under NI 81-102 with respect to the types of derivatives allowed to be used and counterparty concentration. For Funds that are not alternative funds, the differences between the two regimes relate to: (i) counterparty credit ratings; (ii) maximum exposure to options; and (iii) having to hold cash and collateral together with the market value of the derivatives equal to the underlying market exposure of the derivatives (on a mark-to-market basis) where the funds use derivatives for investment purposes.
(f) The rules governing securities lending by the Underlying Funds are comparable to the rules regarding securities lending under NI 81-102 including, the inability to pledge non-cash collateral and the right to immediately recall the securities loaned. The differences between NI 81-102 and the rules pertaining to the Underlying Funds relate to the following: (i) the type and amount of collateral; (ii) the person who may be appointed as agent for securities lending; (iii) the types of securities that may be purchased with collateral received; and (iv) the overall securities lending limits.
(g) Each Underlying Fund makes, or will make, its net asset value of its holdings available to the public at the close of business each day.
(h) Each Underlying Fund is required to prepare a prospectus and prospectus supplement that discloses material facts pertaining to each Underlying Fund. The prospectus, together with the corresponding prospectus supplement, provide disclosure that is similar to the disclosure required to be included in a simplified prospectus under NI 81-101 or in a prospectus under NI 41-101.
(i) Each Underlying Fund publishes a KIID which contains disclosure similar to that required to be included in a fund facts document prepared under NI 81-101 or an ETF facts document under NI 41-101.
(j) Each Underlying Fund is subject to continuous disclosure obligations which are similar to the disclosure obligations of the Funds under National Instrument 81-106 Investment Funds Continuous Disclosure.
(k) The Underlying Fund Manager is subject to approval by the Central Bank of Ireland or the CSSF to permit it to manage and provide portfolio management advice to each Underlying Fund and is subject to an investment management agreement which sets out a duty of care and a standard of care requiring the Underlying Fund Manager to act in the best interest of each Underlying Fund and the shareholders of each Underlying Fund.
(l) All activities of the Underlying Fund Manager must be conducted at all times in accordance with the UCITS Regulations, the UCITS Notices and the investment policy of each Underlying Fund and are at all times subject to the supervision of the board of directors of the UCITS Corporation.
(m) The auditors of each Underlying Fund are required to prepare an audited set of accounts for each Underlying Fund at least annually.
Investment by Funds in the Underlying Funds
20. The investment objective and strategies of each Fund are, or will be, disclosed in each Fund's prospectus or simplified prospectus and any Fund that invests in an Underlying Fund will be permitted to do so in accordance with its investment objectives and strategies.
21. In particular, the investment strategies of each Fund stipulate, or will stipulate, that the Fund may invest a portion of its assets in other investment funds, domestic or foreign, which will permit each Fund to invest in an Underlying Fund.
22. The prospectus or simplified prospectus of each Fund provides, or will provide, all disclosure mandated for investment funds investing in other investment funds.
23. There will be no duplication of management fees or incentive fees as a result of an investment by a Fund in an Underlying Fund.
24. The amount of loss that could result from an investment by a Fund in an Underlying Fund will be limited to the amount invested by the Fund in such Underlying Fund.
25. No sales charges or redemption fees will be paid by a Fund relating to a subscription for, or redemption of, securities of an Underlying Fund.
Rationale for Investment in the Underlying Fund
26. The Filer believes that it is in the best interests of the Funds that they be permitted to invest in the Underlying Funds because such investment would provide an efficient and cost-effective way for the Funds to achieve diversification and obtain unique exposures to the markets in which the Underlying Funds invest.
27. The investment objectives and strategies of the Funds, which contemplate or will contemplate investment in global or international securities, permit or will permit the allocation of assets to global or international securities. As economic conditions change, the Funds may reallocate assets, including on the basis of asset class or geographic region. A Fund will invest in an Underlying Fund to gain exposure to certain unique strategies in global or international markets in circumstances where it would be in the best interests of the Fund to do so through an investment in an investment fund offered elsewhere rather than through investments in individual securities. For example, a Fund will invest in the Underlying Funds in circumstances where certain investment strategies preferred by the Funds are either not available or not cost effective to be implemented through investments in individual securities.
28. By investing in the Underlying Funds, the Funds will obtain the benefits of diversification, which would be more expensive and difficult to replicate using individual securities. This will reduce single issuer risk.
29. Investment by a Fund in an Underlying Fund meets, or will meet, the investment objectives of such Fund.
30. An investment by a Fund in securities of each Underlying Fund will represent the business judgement of responsible persons uninfluenced by considerations other than the best interests of the Fund.
31. Absent the Exemption Sought, the investment restriction in paragraphs 2.5(2)(a)(i) and 2.5(2)(a.1)(i) of NI 81-102 would prohibit a Fund that is a mutual fund or alternative mutual fund, respectively, from purchasing or holding securities of an Underlying Fund because the Underlying Fund is not subject to NI 81-102.
32. Absent the Exemption Sought, the investment restriction in paragraph 2.5(2)(c) of NI 81-102 would prohibit a Fund that is a mutual fund from purchasing or holding securities of an Underlying Fund because the Underlying Fund is not a reporting issuer in the local jurisdiction.
The principal regulator is satisfied that the decision meets the test set out in the Legislation for the principal regulator to make the decision.
The decision of the principal regulator under the Legislation is that the Exemption Sought is granted provided that:
(a) the Underlying Funds qualify as UCITS and are distributed in accordance with the UCITS Regulations, which subject the Underlying Funds to investment restrictions and practices that are substantially similar to those that govern the Funds;
(b) the investment of the Funds in the Underlying Funds otherwise complies with section 2.5 of NI 81-102 when investing in the Underlying Funds, and the prospectus will provide all applicable disclosure mandated for investment funds investing in other investment funds;
(c) a Fund does not invest in an Underlying Fund if, immediately after the investment, more than 10% of its net assets, taken at market value at the time of the investment, would consist of investments in Underlying Funds; and
(d) a Fund shall not acquire any additional securities of an Underlying Fund and shall dispose of any securities of an Underlying Fund then held in the event the regulatory regime applicable to the Underlying Funds is changed in any material way.
Application File #: 2024/0199
SEDAR+ File #: 6113258
National Policy 11-203 Process for Exemptive Relief Applications in Multiple Jurisdictions -- National Instrument 62-104 Take-Over Bids and Issuer Bids -- Relief from the take-over bid requirements in Part 2 of NI 62-104 in connection with proposed normal course purchase of the issuer's Class A Units -- Filer acquired a large block of securities convertible into the Class A Units in a recapitalization transaction that was approved by the issuer's minority security holders -- Filer is seeking flexibility to purchase additional Class A Units in the market and to provide liquidity -- Filer granted relief to acquire Class A Units in the normal course provided that such purchases satisfy the requirements of section 4.1 of NI 62-104, except that, for the purposes of calculating the 5% purchase limit, the number of Class A Units underlying the securities acquired by the Filer pursuant to the issuer's recapitalization transaction will be excluded, and the number of Class A Units underlying other securities of the issuer that are convertible into Class A Units will be included.
National Instrument 62-104 Take-Over Bids and Issuer Bids, Part 2 and s. 6.1.
Citation: Re Daniel Drimmer, 2024 ABASC 64
April 19, 2024
The securities regulatory authority or regulator in each of the Jurisdictions (each a Decision Maker) has received an application from the Filer for a decision under the securities legislation of the Jurisdictions (the Legislation) for an exemption (the Requested Relief) pursuant to Section 6.1 of National Instrument 62-104 Take-Over Bids and Issuer Bids (NI 62-104) from the take-over bid requirements under the Legislation in connection with certain normal course purchases (including deemed purchases) in the market of the class A trust units (the Class A Units) of Northview Residential REIT (the REIT) by the Filer and his affiliates, including D.D. Acquisitions Partnership (DDAP), Starlight West LP (Starlight West) and D.D. Galaxy High Yield Debt LP (DD Galaxy).
Under the Process for Exemptive Relief Applications in Multiple Jurisdictions (for a dual application)
(a) the Alberta Securities Commission is the principal regulator for this application,
(b) the Filer has provided notice that section 4.7(1) of Multilateral Instrument 11-102 Passport System (MI 11-102) is intended to be relied upon in each province of Canada, other than Ontario, and
(c) this decision is the decision of the principal regulator and evidences the decision of the securities regulatory authority or regulator in Ontario.
Terms defined in National Instrument 14-101 Definitions and MI 11-102 have the same meaning if used in this decision, unless otherwise defined.
This decision is based on the following facts represented by the Filer:
1. The Filer holds his interests in the REIT through DDAP, Starlight West and DD Galaxy. DDAP is an Ontario general partnership, the principal business of which is to make investments, with its head office in Toronto, Ontario. Starlight West is an Ontario limited partnership, the principal business of which is to invest in real estate investments, with its head office in Toronto, Ontario. DD Galaxy is an Ontario limited partnership, the principal business of which is to invest in real estate investments, with its head office in Toronto, Ontario. As each of DDAP, Starlight West and DD Galaxy are controlled by the Filer, they are affiliates and deemed joint actors of one another. DDAP, Starlight West, DD Galaxy, and the Filer are collectively referred to as the Significant Unitholders.
2. The REIT is an internally managed, traditional open-ended real estate investment trust focused on national multi-family properties and governed by the laws of Ontario. The REIT's head and registered office is located in Calgary, Alberta.
3. The REIT is currently a reporting issuer in each jurisdiction of Canada. The Class A Units are listed on the Toronto Stock Exchange (TSX) under the symbol "NRR.UN". The class C trust units (Class C Units) and class F trust units (Class F Units) of the REIT are not listed on any exchange, but are each convertible on a 1:1 basis into Class A Units. The Class C Units are also convertible into Class F Units on a 1:1 basis and the Class A Units are convertible into Class F Units on a 1:1 basis.
4. On November 2, 2020, the REIT, then known as "Northview Canadian High Yield Residential Fund" (the Fund), completed its initial public offering of the REIT's Class A Units, Class C Units and Class F Units (collectively, the Units), as well as the acquisition through a plan of arrangement of a portfolio of properties previously owned by Northview Apartment Real Estate Investment Trust (the Initial Transaction). Pursuant to the Initial Transaction, the Fund was formed as a limited-life, closed-end real estate fund. It had a term of three years, subject to two one-year extensions at the discretion of its external manager. The external manager was tasked with proposing a subsequent "recapitalization event" for the Fund. The external manager had significant control over the operations and affairs of the Fund and the CEO and CFO of the Fund were both provided by the external manager, at the external manager's discretion, and the Fund did not undertake, and was not permitted to undertake, any significant activities prior to any such "recapitalization event". In particular, the Fund was not permitted under the terms of its declaration of trust to issue further securities or Units or undertake any equity capital raising activities.
5. On August 21, 2023, the REIT completed a recapitalization transaction (the Recapitalization Transaction) whereby, among other things, the REIT: (i) changed its name from Northview Fund to Northview Residential REIT; (ii) amended its declaration of trust to align with a more traditional real estate investment trust structure and permit it to undertake typical activities of a perpetual real estate investment trust, including the ability to issue further Units and other securities and conduct itself as a typical public real estate investment trust, (iii) subdivided the Class C Units and Class F Units by their exchange ratios such that, among other things, the Class C Units and Class F Units became convertible on a 1:1 basis for Class A Units; and (iv) acquired three portfolios of properties comprising over 3,300 multi-family suites and 119,000 commercial square feet, for $742 million, certain of which properties were owned or partially owned by affiliates of the Significant Unitholders. Immediately following the closing of the Recapitalization Event, the Units were consolidated on a 1.75:1.00 basis. In addition, pursuant to the Recapitalization Transaction, the REIT gained the ability to appoint its own CEO and CFO and its external management arrangements were terminated.
6. Pursuant to the Recapitalization Transaction, an aggregate of: (i) 7,871,777 Class C Units; (ii) 1,973,364 exchangeable class B limited partnership units (Exchangeable Units) of a subsidiary of the REIT that are exchangeable into Class A Units on a 1:1 basis; and (iii) 4,085,202 class B redeemable partnership units (Redeemable Units) of a subsidiary of the REIT were issued as partial consideration for the acquisition of the properties pursuant to the Recapitalization Transaction. The Redeemable Units are redeemable on certain specified dates at a price per Redeemable Unit of $26.355, which redemption price may be satisfied, at the sole option of the REIT, in Class A Units. Each Exchangeable Unit and Redeemable Unit has attached to it an equivalent number of Special Voting Units, each carrying the right to one vote per Special Voting Unit at a meeting of unitholders and special voting unitholders of the REIT. The Significant Unitholders do not hold any Redeemable Units and are not permitted or able to acquire Redeemable Units, as the Redeemable Units are not transferrable except to affiliates of the initial holders thereof (who are arm's length parties to the Significant Unitholders).
7. In addition, pursuant to the Recapitalization Transaction, the then-prevailing "carried interest" represented by Exchangeable Units of a further subsidiary of the REIT and held by Starlight West was satisfied and extinguished through the issuance of 1,611,830 Exchangeable Units of a further subsidiary of the REIT that are exchangeable into Class A Units on a 1:1 basis, and which have attached to them an equivalent number of Special Voting Units, each carrying the right to one vote per Special Voting Unit at a meeting of unitholders and special voting unitholders of the REIT. Immediately following closing of the Recapitalization Transaction, Starlight West exchanged 187,857 Exchangeable Units into 187,857 Class C Units and transferred them to two of its institutional partners in satisfaction of their interest in the "carried interest", and an aggregate of 187,857 Special Voting Units were cancelled accordingly (the Starlight West Exchange).
8. The Recapitalization Transaction was approved by unitholders of the REIT at a special meeting held on August 4, 2023, including by a majority of the minority pursuant, excluding, among others, the votes of the Significant Unitholders pursuant to Multilateral Instrument 61-101 Protection of Minority Security Holders in Special Transactions. The security holdings of the Significant Unitholders in the REIT, both immediately prior to, as well as following closing of, the Recapitalization Transaction, were disclosed in the management information circular dated June 30, 2023 relating to the special meeting.
9. Following completion of the Recapitalization Transaction and the Starlight West Exchange, an aggregate of 3,599,973 Class A Units, 22,765,497 Class C Units, 2,208,018 Class F Units, 3,397,337 Exchangeable Units, and 4,085,202 Redeemable Units were issued and outstanding.
10. Prior to the Recapitalization Transaction, the Significant Unitholders held an aggregate of 282,451 Class A Units and 5,804,029 Class C Units (each on a post-consolidation basis).
11. Pursuant to the Recapitalization Transaction, the Significant Unitholders acquired, as consideration for the Significant Unitholders' indirect interest in the properties vended to the REIT pursuant to the Recapitalization Transaction, and on crystallization of the then-prevailing carried interest, an aggregate of 771,580 Class C Units and 3,585,194 Exchangeable Units (the Recapitalization Blocks). Following completion of the Recapitalization Transaction and the Starlight West Exchange, the Significant Unitholders beneficially owned (including on a deemed basis) or had control or direction over, directly or indirectly, 3,397,337 Exchangeable Units, 282,451 Class A Units and 6,575,609 Class C Units, collectively representing a voting interest in the REIT of 28.44%. The 3,397,337 Exchangeable Units held by the Significant Unitholders represent all of the issued and outstanding Exchangeable Units.
12. Assuming the settlement of all Redeemable Units in cash, the exchange of all Exchangeable Units, and the conversion of all Class C Units and Class F Units into, in each case, Class A Units, there would be 31,970,825 Class A Units outstanding, with the Significant Unitholders holding 10,255,397 Class A Units (or 32.08% of the Class A Units).
13. The Significant Unitholders have not acquired (or been deemed to have acquired pursuant to NI 62-104) any Units or securities exchangeable for Units subsequent to the Recapitalization Transaction.
14. Pursuant to section 1.8 of NI 62-104, the Significant Unitholders have beneficial ownership of greater than 20% of the outstanding Class A Units. Accordingly, any additional acquisitions of Class A Units by the Significant Unitholders or persons acting jointly or in concert with them would constitute a take-over bid, unless an exemption is otherwise available.
15. Subject to applicable law, the Significant Unitholders intend to acquire additional Units from time to time through, among other things, the purchase or sale of Class A Units on the open market, on such terms and at such times as the Significant Unitholders may deem advisable depending upon an ongoing evaluation of the Units, the REIT, prevailing market conditions, the availability of Class A Units at prices that would make the purchase or sale of Class A Units desirable, other investment opportunities, liquidity requirements of the Significant Unitholders or other considerations. If the Significant Unitholders (or persons acting jointly or in concert with them) determine to acquire Class A Units on the open market, it is proposed that such purchases be made, from time to time as considered appropriate, pursuant to the normal course purchase exemption contained in section 4.1 of NI 62-104 (the Normal Course Purchase Exemption).
16. As a result of their acquisition of the Recapitalization Blocks, the Significant Unitholders (and persons acting jointly or in concert with them) are unable to acquire additional Class A Units pursuant to the Normal Course Purchase Exemption until August 21, 2024 (being 12 months after the date that the Significant Unitholders acquired the Recapitalization Blocks). The Significant Unitholders would like the flexibility to acquire (and for their affiliates and associates to acquire, as applicable) additional Class A Units on the TSX between the date of this decision and August 21, 2024. The interests of the Significant Unitholders in being able to acquire Class A Units are not to gain legal control of the REIT but instead to preserve their ability to take advantage of opportunities to purchase Class A Units at attractive prices and to provide liquidity to the market.
17. Pursuant to the Normal Course Purchase Exemption, the Significant Unitholders would be limited to acquiring 5% of the issued and outstanding Class A Units or 164,000 Class A Units, representing 0.45% of the votes attached to all Units and Special Voting Units of the REIT and increasing the Significant Unitholders' voting interest from 28.44% to a maximum of 28.89%. The Significant Unitholders would not be able to effect a legal or effective change of control of the REIT as a result of such purchases.
18. None of the Significant Unitholders have any current intention of making a take-over bid for the outstanding voting or equity securities of any class of the securities of the REIT or securities convertible into securities of the REIT, or otherwise acquiring the REIT by way of a plan of arrangement or other similar voting transaction.
19. None of the Significant Unitholders will purchase any Class A Units when they have knowledge of any material fact or material change about the REIT that has not been generally disclosed.
20. The Significant Unitholders have advised the REIT that they have made an application for the Requested Relief. Management of the REIT supports the Requested Relief on the basis that normal course purchases of Class A Units will provide additional liquidity in the market. The trustees of the REIT, including the independent trustees, are also supportive of the Requested Relief.
Each of the Decision Makers is satisfied that the decision meets the test set out in the Legislation to make the decision.
The decision of the Decision Makers under the Legislation is that the Requested Relief is granted provided that the acquisitions of Class A Units by the Filer and persons acting jointly or in concert with him in the market comply with the Normal Course Purchase Exemption, except that for the purpose of determining the number of Class A Units acquired by the Filer and persons acting jointly or in concert with him within the 12-month period preceding the date of any such purchase of Class A Units in the market
(a) the number of Class A Units underlying the Recapitalization Blocks shall be excluded from the calculation of acquisitions of Class A Units otherwise made by the Filer and persons acting jointly or in concert with him within the previous 12-month period, and
(b) the number of Class A Units underlying any securities convertible, directly or indirectly, into Class A Units that are acquired by the Filer and persons acting jointly or in concert with him shall be included in the calculation of acquisitions of Class A Units otherwise made by the Filer and persons acting jointly or in concert with him within the previous 12-month period.
National Policy 11-203 Process for Exemptive Relief Applications in Multiple Jurisdictions -- National Instrument 62-104 Take-Over Bids and Issuer Bids -- relief from the formal issuer bid requirements in NI 62-104 -- issuer conducting a normal course issuer bid through the facilities of the TSX and NYSE -- relief granted, provided that purchases are subject to a maximum aggregate limit mirroring the TSX NCIB rules.
National Instrument 62-104 Take-Over Bids and Issuer Bids, Part 2 and s. 6.1.
Citation: Re Baytex Energy Corp., 2024 ABASC 67
April 22, 2024
The securities regulatory authority or regulator in each of the Jurisdictions (Decision Maker) has received an application from the Filer for a decision under the securities legislation of the Jurisdictions (the Legislation) that the requirements contained in the Legislation relating to issuer bids (the Issuer Bid Requirements) shall not apply to purchases of the Filer's common shares (Common Shares) made by the Filer through the facilities of the New York Stock Exchange (the NYSE) and other United States-based trading systems (together with the NYSE, U.S. Markets) in connection with the Current Bid (as defined below) and any issuer bid made in the normal course through the facilities of the Toronto Stock Exchange (the TSX) that the Filer commences shortly following the expiry of the Current Bid and that expires not later than August 1, 2025 (each such bid an Exempt Bid and together the Exempt Bids, and such exemption, the Exemption Sought).
Under the Process for Exemptive Relief Applications in Multiple Jurisdictions (for a dual application):
(a) the Alberta Securities Commission is the principal regulator for this application;
(b) the Filer has provided notice that section 4.7(1) of Multilateral Instrument 11-102 Passport System (the MI 11-102) is intended to be relied upon in British Columbia, Saskatchewan, Manitoba, Quebec, New Brunswick, Prince Edward Island, Nova Scotia, and Newfoundland and Labrador; and
(c) the decision is the decision of the principal regulator and evidences the decision of the securities regulatory authority or regulator in Ontario.
Terms defined in National Instrument 14-101 Definitions or MI 11-102 have the same meaning if used in this decision, unless otherwise defined.
This decision is based on the following facts represented by the Filer:
1. The Filer is a corporation existing under the Business Corporations Act (Alberta) and the head office and registered office of the Filer are located in Calgary, Alberta.
2. The authorized share capital of the Filer consists of an unlimited number of Common Shares and up to 10,000,000 preferred shares. As at February 29, 2024, 821,680,619 Common Shares were issued and outstanding and there were no preferred shares issued and outstanding.
3. The Filer is a reporting issuer in each of the provinces of Canada. The Filer is not in default of its obligations as a reporting issuer under the applicable securities legislation in any of the jurisdictions in which it is a reporting issuer.
4. The Filer is a registrant with the SEC and is subject to the requirements of the 1934 Act. For the year ending December 31, 2023, the Filer qualified as a "foreign private issuer" pursuant to the 1934 Act. The Filer is not in default of any requirements under the 1934 Act.
5. The Common Shares are listed for trading on the TSX and the NYSE.
6. The Common Shares commenced trading on the NYSE on February 23, 2023 (the NYSE Listing Date).
7. On June 20, 2023 (the Ranger Acquisition Date), the Filer completed its acquisition of Ranger Oil Corporation (Ranger), a company incorporated under the laws of Virginia, pursuant to which holders of Ranger common stock were entitled to receive 7.49 Common Shares plus US$13.31 cash for each share of Ranger common stock, resulting in the issuance of an aggregate of 311,369,555 Common Shares to former holders of Ranger common stock (the Ranger Acquisition). The majority of the Common Shares issued in connection with the Ranger Acquisition were issued to U.S. residents.
8. On June 23, 2023, the Filer announced that the TSX had accepted its Notice of Intention to Make a Normal Course Issuer Bid (the Current Notice) during the 12-month period commencing June 29, 2023 and ending June 28, 2024 to purchase up to 68,417,028 Common Shares representing approximately 10% of the Filer's public float (as of the date specified in the Current Notice) (the Current Bid).
9. The Current Notice specifies that purchases under the Current Bid will be effected through the facilities of the TSX, the NYSE and/or alternative trading systems in Canada and the United States.
10. Issuer bid purchases made in the normal course through the facilities of the TSX are, and will be, conducted in reliance upon the exemption from the Issuer Bid Requirements set out in subsection 4.8(2) of National Instrument 62-104 Take-Over Bids and Issuer Bids (NI 62-104, and such exemption, the Designated Exchange Exemption). The Designated Exchange Exemption provides that an issuer bid made in the normal course through the facilities of a designated exchange is exempt from the Issuer Bid Requirements if the bid is made in accordance with the bylaws, rules, regulations and policies of that exchange. The TSX is a designated exchange for the purposes of the Designated Exchange Exemption.
11. The TSX's rules governing the conduct of normal course issuer bids (the TSX NCIB Rules) are set out, inter alia, in Sections 628 to 629.3 of Part VI of the TSX Company Manual. The TSX NCIB Rules permit a listed issuer to acquire, over a 12-month period commencing on the date specified in the Notice of Intention to Make a Normal Course Issuer Bid (a Notice), up to the greater of (a) 10% of the public float on the date specified in the Notice, or (b) 5% of such class of securities issued and outstanding on the date specified in the Notice.
12. Other than purchases made in reliance on this decision, purchases under issuer bids made in the normal course through the facilities of the U.S. Markets and alternative trading systems in Canada are, and will be, conducted in reliance upon the exemption from the Issuer Bid Requirements set out in subsection 4.8(3) of NI 62-104 (the Published Markets Exemption). The Published Markets Exemption provides that an issuer bid made in the normal course on a published market, other than a designated exchange, is exempt from the Issuer Bid Requirements if, among other things, the bid is for not more than 5% of the outstanding securities of a class of securities of the issuer and the aggregate number of securities acquired in reliance on the Published Markets Exemption by the issuer and any person acting jointly or in concert with the issuer within any 12-month period does not exceed 5% of the securities of that class outstanding at the beginning of the 12-month period.
13. As a result, normal course issuer bid purchases of Common Shares through the U.S. Markets in reliance on the Published Market Exemption, including pursuant to the Current Bid, cannot exceed 5% of the issued and outstanding Common Shares as the date of the Current Notice or any future Notice.
14. As of February 29, 2024, the Filer had purchased 40,511,792 Common Shares under the Current Bid, of which: (a) 39,311,492 Common Shares (or approximately 97%) were purchased through the facilities of the U.S. Markets; (b) 793,300 Common Shares (or approximately 2%) were purchased through the facilities of the TSX; and (c) 406,800 Common Shares (or approximately 1%) were purchased through Canadian published markets other than the TSX.
15. For the period ended February 29, 2024 and commencing on the NYSE Listing Date, an aggregate of 3,931,765,141 Common Shares were traded over published markets in Canada and the United States, with trading volumes having occurred as follows:
(a) 1,208,131,263 Common Shares (or approximately 31% of total aggregate trading) over the facilities of the TSX;
(b) 1,083,758,988 Common Shares (or approximately 28% of total aggregate trading) over published markets in Canada other than the TSX; and
(c) 1,639,874,890 Common Shares (or approximately 42% of total aggregate trading) over U.S. Markets.
16. For the period ended February 29, 2024 and commencing on the Ranger Acquisition Date, an aggregate of 3,030,765,842 Common Shares were traded over published markets in Canada and the United States, with trading volumes having occurred as follows:
(a) 842,452,230 Common Shares (or approximately 28% of total aggregate trading) over the facilities of the TSX;
(b) 759,849,956 Common Shares (or approximately 25% of total aggregate trading) over published markets in Canada other than the TSX; and
(c) 1,428,463,566 Common Shares (or approximately 47% of total aggregate trading) over U.S. Markets.
17. The Filer's daily trading volume of the Common Shares on the U.S. Markets was greater than the trading volume on the TSX for a significant majority of trading days. From the Ranger Acquisition date to February 29, 2024, the trading volume of the Common Shares on the U.S. Markets was greater than the trading volume on the TSX on approximately 92% of the dates on which both the TSX and NYSE were open for trading.
18. As a result of certain factors, including the Ranger Acquisition and a resulting increase in the number of Common Shares held by U.S. residents, the Filer expects that the trading volume of the Common Shares on the U.S. Markets will increase and that the trading volume of the Common Shares on the TSX will decrease going forward such that the future trading volume of the Common Shares on the U.S. Markets will be significantly greater than that on the TSX.
19. In addition, as a higher volume of Common Shares currently trades through the U.S. Markets, relative to the TSX, the Filer wishes to have the ability to make repurchases under the Exempt Bids over the U.S. Markets in excess of the maximum allowable in reliance on the Published Markets Exemption, up to the maximum authorized and approved by its board of directors and permissible by the TSX.
20. The Exempt Bids will be effected in accordance with all applicable securities laws, including the 1934 Act, the 1933 Act, and the rules of the SEC made pursuant thereto, and any applicable bylaws, rules, regulations or policies of the U.S. Markets on which the purchases are carried out (collectively, the Applicable U.S. Rules).
21. In connection with the Exempt Bids, the Filer will rely on the "safe harbour" provided by Rule 10b-18 under the 1934 Act (Rule 10b-18) in respect of the provisions of the 1934 Act precluding market manipulation. In order for the Filer to comply with Rule 10b-18, all purchases made by or on behalf of the Filer through the U.S. Markets are required:
(a) to be made through only one broker or dealer in any one day;
(b) not to be made at the opening of a trading session or during the 10 minutes before the scheduled close of a trading session;
(c) not to be made at prices higher than the highest published independent bid or last reported independent transaction price (whichever is higher) on the consolidated system for securities listed on the NYSE; and
(d) to be in an amount that does not exceed, in any one day, an aggregate amount equal to 25% of the average daily trading volume over the U.S. Markets (with certain limited exceptions for block purchases).
22. Under the Applicable U.S. Rules, there is no aggregate limit on the number of Common Shares that may be purchased by the Filer through the facilities of the U.S. Markets.
23. The Filer believes that the Exempt Bids are in the best interests of the Filer.
24. No other exemptions exist under applicable Canadian securities legislation that would permit the Filer to continue to make purchases under the Exempt Bids through the U.S. Markets on an exempt basis once the Filer has purchased, within a 12-month period, 5% of the outstanding Common Shares in reliance on the Published Markets Exemption.
25. The purchase of Common Shares pursuant to the Exempt Bids will not adversely affect the Filer or the rights of any of the Filer's security holders and such purchases will not materially affect control of the Filer.
Each of the Decision Makers is satisfied that the decision meets the test set out in the Legislation for the Decision Maker to make the decision.
The decision of the Decision Makers under the Legislation is that the Exemption Sought is granted provided that:
(a) the Exempt Bids are permitted under the Applicable U.S. Rules, and are established and conducted in accordance and compliance with the Applicable U.S. Rules;
(b) the Notice accepted by the TSX in respect of an Exempt Bid specifically contemplates that purchases under such bid will also be effected through U.S. Markets;
(c) purchases of Common Shares under an Exempt Bid in reliance on this decision shall only be made:
(i) in compliance with Part 6 (Order Protection) of National Instrument 23-101 Trading Rules;
(ii) at a price which complies with the requirements of paragraph 4.8(3)(c) of NI 62-104; and
(iii) in accordance with the TSX NCIB Rules.
(d) prior to purchasing Common Shares under any Exempt Bid in reliance on this decision, the Filer issues and files a press release setting out the terms of the Exemption Sought and the conditions applicable thereto;
(e) the Filer does not acquire Common Shares in reliance on the Published Markets Exemption if the aggregate number of Common Shares purchased by the Filer, and any person or company acting jointly or in concert with the Filer, in reliance on this decision and the Published Markets Exemption within any period of 12 months exceeds 5% of the outstanding Common Shares on the first day of such 12-month period; and
(f) the aggregate number of Common Shares purchased pursuant to an Exempt Bid in reliance on this decision, the Designated Exchange Exemption and the Published Markets Exemption does not exceed, over the 12-month period specified in the Notice in respect of the relevant Exempt Bid, 10% of the public float as specified in such Notice.
Temporary, Permanent & Rescinding Issuer Cease Trading Orders
Company Name |
Date of Temporary Order |
Date of Hearing |
Date of Permanent Order |
Date of Lapse/Revoke |
|
||||
THERE IS NOTHING TO REPORT THIS WEEK. |
||||
Company Name |
Date of Order |
Date of Revocation |
|
||
Permex Petroleum Corporation |
April 16, 2024 |
__________ |
|
||
VBI Vaccines Inc. |
April 8, 2024 |
April 16, 2024 |
B.4.2 Temporary, Permanent & Rescinding Management Cease Trading Orders
Company Name |
Date of Order |
Date of Lapse |
|
||
THERE IS NOTHING TO REPORT THIS WEEK. |
||
Outstanding Management & Insider Cease Trading Orders
Company Name |
Date of Order or Temporary Order |
Date of Hearing |
Date of Permanent Order |
Date of Lapse/Expire |
Date of Issuer Temporary Order |
|
|||||
Performance Sports Group Ltd. |
19 October 2016 |
31 October 2016 |
31 October 2016 |
__________ |
__________ |
Company Name |
Date of Order |
Date of Lapse |
|
||
Agrios Global Holdings Ltd. |
September 17, 2020 |
__________ |
|
||
Sproutly Canada, Inc. |
June 30, 2022 |
__________ |
|
||
iMining Technologies Inc. |
September 30, 2022 |
__________ |
|
||
Alkaline Fuel Cell Power Corp. |
April 4, 2023 |
__________ |
|
||
mCloud Technologies Corp. |
April 5, 2023 |
__________ |
|
||
FenixOro Gold Corp. |
July 5, 2023 |
__________ |
|
||
HAVN Life Sciences Inc. |
August 30, 2023 |
__________ |
|
||
Biovaxys Technology Corp. |
February 29, 2024 |
__________ |
|
||
Helix BioPharma Corp. |
March 25, 2024 |
__________ |
|
||
Payfare Inc. |
April 3, 2024 |
__________ |
|
||
Perk Labs Inc. |
April 4, 2024 |
__________ |
Issuer Name:
Type and Date:
Offering Price and Description:
Underwriter(s) or Distributor(s):
Promoter(s):
Filing #06113748
- - - - - - - - - - - - - - - - - - - - - - - - - - - - - - - - - - - - - - - - - - - - - - - - - -
Issuer Name:
Type and Date:
Offering Price and Description:
Underwriter(s) or Distributor(s):
Promoter(s):
Filing # 06026554
- - - - - - - - - - - - - - - - - - - - - - - - - - - - - - - - - - - - - - - - - - - - - - - - - -
Issuer Name:
Type and Date:
Offering Price and Description:
Underwriter(s) or Distributor(s):
Promoter(s):
Filing # 06006900
- - - - - - - - - - - - - - - - - - - - - - - - - - - - - - - - - - - - - - - - - - - - - - - - - -
Issuer Name:
Type and Date:
Offering Price and Description:
Underwriter(s) or Distributor(s):
Promoter(s):
Filing # 03548224
- - - - - - - - - - - - - - - - - - - - - - - - - - - - - - - - - - - - - - - - - - - - - - - - - -
Issuer Name:
Type and Date:
Offering Price and Description:
Underwriter(s) or Distributor(s):
Promoter(s):
Filing # 06030505
- - - - - - - - - - - - - - - - - - - - - - - - - - - - - - - - - - - - - - - - - - - - - - - - - -
Issuer Name:
Type and Date:
Offering Price and Description:
Underwriter(s) or Distributor(s):
Promoter(s):
Filing # 06114207
- - - - - - - - - - - - - - - - - - - - - - - - - - - - - - - - - - - - - - - - - - - - - - - - - -
Issuer Name:
Type and Date:
Offering Price and Description:
Underwriter(s) or Distributor(s):
Promoter(s):
Filing # 06113748
- - - - - - - - - - - - - - - - - - - - - - - - - - - - - - - - - - - - - - - - - - - - - - - - - -
Issuer Name:
Type and Date:
Offering Price and Description:
Underwriter(s) or Distributor(s):
Promoter(s):
Filing #06096884
- - - - - - - - - - - - - - - - - - - - - - - - - - - - - - - - - - - - - - - - - - - - - - - - - -
Issuer Name:
Type and Date:
Offering Price and Description:
Underwriter(s) or Distributor(s):
Promoter(s):
Filing #06114680
- - - - - - - - - - - - - - - - - - - - - - - - - - - - - - - - - - - - - - - - - - - - - - - - - -
Issuer Name:
Type and Date:
Offering Price and Description:
Underwriter(s) or Distributor(s):
Promoter(s):
Filing #06030324
- - - - - - - - - - - - - - - - - - - - - - - - - - - - - - - - - - - - - - - - - - - - - - - - - -
Issuer Name:
Type and Date:
Offering Price and Description:
Underwriter(s) or Distributor(s):
Promoter(s):
Filing #06096715
- - - - - - - - - - - - - - - - - - - - - - - - - - - - - - - - - - - - - - - - - - - - - - - - - -
Issuer Name:
Type and Date:
Offering Price and Description:
Underwriter(s) or Distributor(s):
Promoter(s):
Filing #06101747
- - - - - - - - - - - - - - - - - - - - - - - - - - - - - - - - - - - - - - - - - - - - - - - - - -
Issuer Name:
Type and Date:
Offering Price and Description:
Underwriter(s) or Distributor(s):
Promoter(s):
Filing #06114207
- - - - - - - - - - - - - - - - - - - - - - - - - - - - - - - - - - - - - - - - - - - - - - - - - -
Issuer Name:
Type and Date:
Offering Price and Description:
Underwriter(s) or Distributor(s):
Promoter(s):
Filing #06114929
- - - - - - - - - - - - - - - - - - - - - - - - - - - - - - - - - - - - - - - - - - - - - - - - - -
Issuer Name:
Type and Date:
Offering Price and Description:
Underwriter(s) or Distributor(s):
Promoter(s):
Filing #06114636
- - - - - - - - - - - - - - - - - - - - - - - - - - - - - - - - - - - - - - - - - - - - - - - - - -
Issuer Name:
Type and Date:
Offering Price and Description:
Underwriter(s) or Distributor(s):
Promoter(s):
Filing #06109604
- - - - - - - - - - - - - - - - - - - - - - - - - - - - - - - - - - - - - - - - - - - - - - - - - -
Issuer Name:
Type and Date:
Offering Price and Description:
-
Underwriter(s) or Distributor(s):
-
Promoter(s):
-
Filing # 06114399
- - - - - - - - - - - - - - - - - - - - - - - - - - - - - - - - - - - - - - - - - - - - - - - - - -
Issuer Name:
Type and Date:
Offering Price and Description:
-
Underwriter(s) or Distributor(s):
-
Promoter(s):
-
Filing #06114680
- - - - - - - - - - - - - - - - - - - - - - - - - - - - - - - - - - - - - - - - - - - - - - - - - -
Issuer Name:
Type and Date:
Offering Price and Description:
-
Underwriter(s) or Distributor(s):
-
Promoter(s):
-
Filing # 06116644
- - - - - - - - - - - - - - - - - - - - - - - - - - - - - - - - - - - - - - - - - - - - - - - - - -
Issuer Name:
Type and Date:
Offering Price and Description:
-
Underwriter(s) or Distributor(s):
-
Promoter(s):
-
Filing #06113748
- - - - - - - - - - - - - - - - - - - - - - - - - - - - - - - - - - - - - - - - - - - - - - - - - -
Issuer Name:
Type and Date:
Offering Price and Description:
-
Underwriter(s) or Distributor(s):
-
Promoter(s):
-
Filing #06113730
- - - - - - - - - - - - - - - - - - - - - - - - - - - - - - - - - - - - - - - - - - - - - - - - - -
Issuer Name:
Type and Date:
Offering Price and Description:
-
Underwriter(s) or Distributor(s):
-
Promoter(s):
-
Filing #03536776
- - - - - - - - - - - - - - - - - - - - - - - - - - - - - - - - - - - - - - - - - - - - - - - - - -
Issuer Name:
Type and Date:
Offering Price and Description:
-
Underwriter(s) or Distributor(s):
-
Promoter(s):
-
Filing # 06096884
- - - - - - - - - - - - - - - - - - - - - - - - - - - - - - - - - - - - - - - - - - - - - - - - - -
Issuer Name:
Type and Date:
Offering Price and Description:
-
Underwriter(s) or Distributor(s):
-
Promoter(s):
-
Filing #06114929
- - - - - - - - - - - - - - - - - - - - - - - - - - - - - - - - - - - - - - - - - - - - - - - - - -
Issuer Name:
Type and Date:
Offering Price and Description:
-
Underwriter(s) or Distributor(s):
-
Promoter(s):
-
Filing # 06114636
- - - - - - - - - - - - - - - - - - - - - - - - - - - - - - - - - - - - - - - - - - - - - - - - - -
Issuer Name:
Type and Date:
Offering Price and Description:
-
Underwriter(s) or Distributor(s):
-
Promoter(s):
-
Filing #06030445
- - - - - - - - - - - - - - - - - - - - - - - - - - - - - - - - - - - - - - - - - - - - - - - - - -
Issuer Name:
Type and Date:
Offering Price and Description:
-
Underwriter(s) or Distributor(s):
-
Promoter(s):
-
Filing #06113730
- - - - - - - - - - - - - - - - - - - - - - - - - - - - - - - - - - - - - - - - - - - - - - - - - -
Issuer Name:
Type and Date:
Offering Price and Description:
-
Underwriter(s) or Distributor(s):
-
Promoter(s):
-
Filing #06113748
- - - - - - - - - - - - - - - - - - - - - - - - - - - - - - - - - - - - - - - - - - - - - - - - - -
Issuer Name:
Principal Regulator -- British Columbia
Type and Date:
Offering Price and Description:
Filing # 06109772
- - - - - - - - - - - - - - - - - - - - - - - - - - - - - - - - - - - - - - - - - - - - - - - - - -
Issuer Name:
Principal Regulator -- Ontario
Type and Date:
Offering Price and Description:
Filing # 06113312
- - - - - - - - - - - - - - - - - - - - - - - - - - - - - - - - - - - - - - - - - - - - - - - - - -
Issuer Name:
Principal Regulator -- British Columbia
Type and Date:
Offering Price and Description:
Filing # 06114006
- - - - - - - - - - - - - - - - - - - - - - - - - - - - - - - - - - - - - - - - - - - - - - - - - -
Issuer Name:
Principal Regulator -- British Columbia
Type and Date:
Offering Price and Description:
Filing # 06114006
- - - - - - - - - - - - - - - - - - - - - - - - - - - - - - - - - - - - - - - - - - - - - - - - - -
Issuer Name:
Principal Regulator -- Ontario
Type and Date:
Offering Price and Description:
Filing # 06073112
- - - - - - - - - - - - - - - - - - - - - - - - - - - - - - - - - - - - - - - - - - - - - - - - - -
Issuer Name:
Principal Regulator -- Ontario
Type and Date:
Offering Price and Description:
Filing # 06113025
- - - - - - - - - - - - - - - - - - - - - - - - - - - - - - - - - - - - - - - - - - - - - - - - - -
Type |
Company |
Category of Registration |
Effective Date |
|
|||
Name Change |
From WILLOW RET FINANCIAL SERVICES INC. to Guiker Financial Services Inc. |
Exempt Market Dealer |
April 5, 2024 |
|
|||
New Registration |
Myelin Capital Inc. |
Exempt Market Dealer |
April 17, 2024 |
|
|||
Voluntary Surrender |
HSBC SECURITIES (CANADA) INC./ VALEURS MOBILIERES HSBC (CANADA) INC. |
Investment Dealer |
March 29, 2024 |
|
|||
Voluntary Surrender |
HSBC INVESTMENT FUNDS (CANADA) INC./FONDS D'INVESTISSEMENT HSBC (CANADA) INC. |
Mutual Fund Dealer |
March 29, 2024 |
|
|||
Voluntary Surrender |
HSBC Private Investment Counsel (Canada) Inc./ Gestion privee de placement HSBC (Canada) Inc. |
Portfolio Manager |
March 29, 2024 |
|
|||
Voluntary Surrender |
MORNINGSTAR ASSOCIATES INC. |
Portfolio Manager |
February 12, 2024 |
Canadian Investment Regulatory Organization (CIRO) -- Proposed Integrated Fee Model -- Request for Comment
CIRO is publishing for comment its proposed Integrated Fee Model (Fee Model). The Fee Model is expected to be effective April 1, 2025, and replaces the Interim Fee Model Guidelines Applicable to Investment Dealer Members and Marketplace Members and the Interim Fee Model Guidelines for Mutual Fund Dealers (Interim Fee Models).
The Fee Model will bring a consistent and harmonized approach to cost recovery for dealer regulation that can be applied to all Dealer Members, along with an update pertaining to equity market regulation fees.
The CIRO Bulletin has three parts addressing changes compared to the existing Interim Fee Models:
Part I -- Annual Dealer Member Fee
Part II -- Membership Application Fees and Fees for Dealer Member Business Changes
Part III -- Qualified Market Maker Discount
Attached appendices to the CIRO Bulletin include consequential rule amendments to Mutual Fund Dealer Rules and the Integration Cost Recovery Fee Model, as well as Frequently Asked Questions to further explain details and provide example calculations.
A copy of the CIRO Bulletin is also available on the Commission's website at www.osc.ca. The comment period ends on June 24, 2024.
LMAX Pte. Ltd. -- Application for Exemption from Recognition as an Exchange -- Notice and Request for Comment
LMAX Pte. Ltd (LMAX) has applied to the Commission for an exemption from the requirement to be recognized as an exchange pursuant to subsection 21(1) of the Securities Act (Ontario) (OSA).
LMAX is a marketplace for trading FX non-deliverable forward contracts and is regulated by the Monetary Authority of Singapore (MAS). LMAX intends to provide direct access to trading on its marketplace to eligible participants located in Ontario and therefore is considered to be carrying on business in Ontario.
As LMAX will be carrying on business in Ontario, it is required to be recognized as an exchange under the OSA or apply for an exemption from this requirement. LMAX has applied for an exemption from the recognition requirement on the basis that it is already subject to regulatory oversight by the MAS.
In the application, LMAX has outlined how it meets the criteria for exemption from recognition. The specific criteria can be found in Appendix I of the draft exemption order. Subject to comments received, Staff intends to recommend that the Commission grant an exemption order with terms and conditions based on the draft exemption order. The application and draft exemption order are available on our website at www.osc.ca.
The Commission is publishing for public comment the LMAX application and draft exemption order. We are seeking comment on all aspects of the application and draft exemption order.
Please provide your comments in writing, via e-mail, on or before May 27, 2024, to the attention of:
The confidentiality of submissions cannot be maintained as the comment letters and a summary of written comments received during the comment period will be published.
Questions may be referred to:
April 18, 2024
VIA OSC ELECTRONIC PORTAL
Reference: 43968/1
RE: LMAX Pte. Ltd. -- Application for Exemption from Recognition as an Exchange
Dear Sirs and Mesdames:
We act as counsel to LMAX Pte. Ltd. (the "Applicant"). We are writing on behalf of the Applicant to request an order for the following relief (collectively, the "Requested Relief") in relation to its operation of an organised market (an "OM"), as defined in the First Schedule to the Singapore Securities and Futures Act 2001 ("SFA"), in the province of Ontario:
(a) exempting the Applicant from the requirement to be recognised as an exchange under subsection 21(1) of the Securities Act (Ontario) (the "Act") pursuant to section 147 of the Act; and
(b) exempting the Applicant from the requirements in National Instrument 21-101 Marketplace Operation ("NI 21-101") pursuant to section 15.1 of NI 21-101, the requirements of National Instrument 23-101 Trading Rules ("NI 23-101") pursuant to section 12.1 of NI 23-101 and the requirements of National Instrument 23-103 Electronic Trading and Direct Electronic Access to Marketplaces ("NI 23-103") pursuant to section 10 of NI 23-103.
This application is divided into Parts I to IV. Part I introduces the Applicant's services. Part II provides background on the Applicant. Part III applies the criteria for an exemption from the requirement to be recognized applicable to a foreign exchange that facilitates trading of OTC derivatives, as set out by the Ontario Securities Commission (the "Commission"), to the Applicant's proposal to permit Ontario Participants, as defined herein, to trade foreign exchange non-deliverable forward contracts ("FX NDFs" or the "OM Instruments") on the Applicant's trading platform. Part IV contains the submissions of the Applicant concerning the Request Relief.
1.1 The Applicant has obtained recognition as a recognised market operator ("RMO") from the Monetary Authority of Singapore (the "MAS" or "Foreign Regulator").
1.2 The Applicant is the operator of an OM, operated under the trading nameLMAX Exchange, that is regulated and authorised by the MAS to allow trading of FX NDFs.
1.3 LMAX Exchange is an order-driven trading system, through which transactions in the OM Instruments are placed and matched on the basis of firm orders that are continuously made available to participants, which requires market makers to maintain bid and offer orders for a central limit orderbook ("CLOB") in a size that balances the needs of participants to deal in a commercial size and the risk to which the market maker exposes itself. For each financial instrument, the best bid and offer by price of each market maker in that instrument, together with the volumes attaching to those prices, shall be public in the CLOB.
1.4 The Applicant is not involved in, nor is it responsible for, settlement or clearing of FX NDFs and the counterparties to such trades make their own bilateral arrangements.
1.5 The Applicant is authorised by the MAS to offer trading on LMAX Exchange for FX NDFs. Additional products may be made available for trading on LMAX Exchange by the Applicant in the future, subject to obtaining required regulatory approvals.
1.6 The Applicant seeks the Requested Relief to make trading in OM Instruments via LMAX Exchange available to participants located in Ontario, including participants with their headquarters or legal address in Ontario (e.g., as indicated by a participant's Legal Entity Identifier (LEI)) and all traders conducting transactions on its behalf, regardless of the traders' physical location (inclusive of non-Ontario branches of Ontario legal entities), as well as any trader physically located in Ontario who conducts transactions on behalf of any other entity ("Ontario Participants").
1.7 The Applicant proposes to offer direct access to trading on LMAX Exchange to Ontario Participants that satisfy the criteria specified in PART III below. The Applicant does not offer access to retail clients.
1.8 The Applicant has no physical presence in Ontario and does not otherwise carry on business in Ontario except as described herein.
1.1 The Applicant is a private limited company incorporated under the laws of the Republic of Singapore and a wholly owned direct subsidiary of LMAX Exchange Group Limited, a private limited company incorporated under the laws of the Bailiwick of Jersey ("LEGL").
2.1 As of the date of this application, the Applicant provides participants with transaction execution and matching services for FX NDFs and seeks the Requested Relief to cover trading of all OM Instruments by Ontario Participants. Additional products may be added in the future, subject to obtaining any required regulatory approvals.
2.2 The Applicant is authorised by the MAS to offer trading on LMAX Exchange for FX NDFs. The following FX NDFs are currently available for trading on the LMAX Exchange:
(a) Asian USD Crosses: INR, KRW, TWD, CNY, IDR, PHP
(b) Tenors: 1 Month, "EOM", "IMM"
2.3 The Applicant will only make FX NDFs available to Ontario Participants, which may include FX NDFs crossed between currencies or with tenors other than those listed above.
3.1 Members and DMA Clients (as defined in the LMAX Exchange RMO Rulebook (the "RMO Rulebook"){1}) of Members are able to access the LMAX Exchange directly as a participant.
3.2 Participants may include a wide range of sophisticated customers, including commercial and investment banks, corporations, pension funds, money managers, proprietary trading firms, market makers, hedge funds and other institutional and professional customers. Each Ontario Participant that wishes to trade on LMAX Exchange must satisfy eligibility criteria that the Applicant may set from time to time, in accordance with the RMO Rulebook, and must be a Bank Member (as defined below) of LMAX Exchange or a DMA Client of a Bank Member. Participant criteria are described in more detail in PART III, Section 4 below.
The following is a discussion of how the Applicant, as a foreign exchange that allows participants to trade the OM Instruments, meets the criteria for exemption from recognition as an exchange.
1.1 Regulation of the Exchange -- The exchange is regulated in an appropriate manner in another jurisdiction by a foreign regulator ("Foreign Regulator").
1.1.1 LMAX Exchange is an "organised market", as defined in the SFA and the relevant rules and regulations of the MAS as:
(a) a place at which, or a facility (whether electronic or otherwise) by means of which, offers or invitations to exchange, sell or purchase derivatives contracts, securities or units in collective investment schemes, are regularly made on a centralised basis, being offers or invitations that are intended or may reasonably be expected to result, whether directly or indirectly, in the acceptance or making, respectively, of offers to exchange, sell or purchase derivatives contracts, securities or units in collective investment schemes (whether through that place or facility or otherwise); or
(b) such other facility or class of facilities as the MAS may, by order, prescribe.
1.1.2 The MAS originally recognised the Applicant as an RMO and commenced supervising the Applicant on an ongoing, active basis in November 2023. The Applicant's current recognition from the MAS, dated November 17, 2023, permits the Applicant to:
(a) operate an OM in respect of over-the-counter derivatives contracts (e.g., credit default swaps, interest rate swaps, foreign exchange derivatives, and commodity derivatives); and
(b) in respect of participants in Singapore, make available its OM to Professional Investors, Accredited Investors and Expert Investors, as such terms are defined within the Applicant's RMO Recognition Letter and the SFA.
1.1.3 RMOs that are authorised by the MAS must comply with relevant legislation under the purview of the MAS, including the SFA and its associated regulations, relevant subsidiary legislation, and relevant notices, guidelines and circulars issued by the MAS (collectively, the "Applicable Rules"), particularly those in:
(a) Part II, Division 1, Part II, Division 3 and Part II, Division 4 of the SFA setting out the general framework regulating the establishment of OMs, RMOs and the general powers of the MAS in relation to RMOs;
(b) the Securities and Futures (Organised Markets) Regulations 2018 setting out in greater detail the statutory requirements that RMOs must adhere to under the SFA;
(c) Part IX, Division 3 of the SFA and under the Criminal Procedure Code, which sets out the powers of investigation and enforcement of the MAS;
(d) Section 8 of the SFA, which sets out the authorization requirements for applicants wishing to operate an OM in Singapore;
(e) the Applicant's RMO Recognition Letter and applicable regulations and notices relating to capital requirements;
(f) Section 33 of the SFA, which requires RMOs to operate a fair OM that is characterised by non-discriminatory access to market facilities and information.
1.2 Authority of the Foreign Regulator -- The Foreign Regulator has the appropriate authority and procedures for oversight of the exchange. This includes regular, periodic oversight reviews of the exchange by the Foreign Regulator.
1.2.1 The Applicant is subject to regulatory supervision by the MAS in conducting its activities for which it is authorised as set out in Section 1.1.2 above. The MAS has a number of competencies which empower it to supervise and, if necessary, investigate and take enforcement action in relation to the Applicant and its operation of LMAX Exchange.
1.2.2 The MAS performs its supervisory responsibilities and promotes compliance with the Applicable Rules by checking on the quality of corporate governance, internal controls and risk management of RMOs and RMOs' dealings with their customers and counterparties, with the aim of instilling a system of sound management practices commensurate with the RMOs' type, scale and complexity of business activities, and their related risks.
1.2.3 The Applicant is subject to standard, base-level monitoring. In addition to routine supervisory activities, this includes monitoring key indicators and the development of the Applicant's business, reviewing regulatory returns, questionnaires and audit reports, as well as taking any necessary follow-up actions.
1.2.4 The Applicant must, as soon as practicable after the occurrence of any of the following circumstances, notify MAS of:
• any material change to the information provided by the Applicant in its application for recognition as an RMO;
• the Applicant becoming aware of any financial irregularity or other matter which in its opinion may affect its ability to discharge its financial obligations, or may affect the ability of a participant of the Applicant to meet its financial obligations to the Applicant;
• any civil or criminal legal proceeding instituted against the Applicant, whether in Singapore or elsewhere, that may have a material impact on the operations or finances of the Applicant;
• any disciplinary action taken against the Applicant by any regulatory authority, whether in Singapore or elsewhere, other than by the MAS;
• any material change to the regulatory requirements imposed on the Applicant by any regulatory authority, whether in Singapore or elsewhere, other than by the MAS;
• any material disruption, material suspension or material termination of, or delay in, any trading procedure or trading practice of the Applicant (including any material disruption, suspension, termination or delay resulting from any system failure);
• the Applicant becoming aware of any acquisition or disposal by any person of a substantial shareholding in the Applicant;
• any compromise of the integrity or security of the transmission or storage of any user information of the Applicant; or
• any action taken or intended to be taken to restore the integrity and security of the transmission and storage of that user information.
1.2.5 The MAS has powers of investigation to, among other things, ensure compliance with the SFA or to investigate an alleged or suspected contravention of any provision of the SFA.
1.2.6 The MAS' statutory powers of investigation include:
• the power to require a person to give to the MAS all reasonable assistance in connection with an investigation and to appear before an officer of the MAS duly authorised by the MAS for examination on oath and to answer questions;
• the power to order production of books;
• officers, authorised by MAS, being able to enter premises without a warrant; or
• applying for a warrant to seize books.
1.2.7 Besides the MAS' statutory investigation powers, the MAS also has criminal investigation powers under the Criminal Procedure Code (Cap 68) ("CPC") to jointly investigate breaches of all offences under the SFA, among other legislation, together with the Singapore Police Force's Commercial Affairs Department under the Joint Investigation Arrangement.
1.2.8 As part of the Joint Investigation Arrangement, certain MAS officers are gazetted as Commercial Affairs Officers under the Police Force Act (Cap 235), and vested with criminal investigation powers under the CPC. Such powers give MAS the ability to, among other things, to:
• obtain documents;
• record statements from persons under investigation or persons who may have information to assist in investigations;
• arrest and conduct search and seizure of property;
• direct a financial institution not to allow any dealings in respect of property in an account or safe deposit box with the financial institution;
• access, inspect and decrypt the data contained in the computers and devices where computers and electronic devices are seized; and
• require suspects to surrender their travel documents to prevent suspects from leaving the country.
1.2.9 The MAS can impose a wide range of enforcement measures if the Applicant breaches the Applicable Rules. For example, the MAS may:
• refer a case for criminal prosecution;
• take civil penalty action;
• withdraw or suspend licence or regulatory status;
• remove persons from office;
• issue prohibition orders;
• issue compositions;
• issue reprimands; or
• issue warnings/letters of advice.
2.1 Governance -- The governance structure and governance arrangements of the exchange ensure:
(a) effective oversight of the Exchange,
2.1.1 The Applicant's Board of Directors (the "Board"), which, as of the date of this application, consists of a total of four members, is responsible for oversight of LMAX Exchange. All directors are employees of the Applicant, LEGL, or a subsidiary of LEGL (collectively, the "LMAX Group") and were appointed by LEGL. The directors collectively bring together the necessary skills to effectively manage the operational and strategic vision of LMAX Exchange.
2.1.2 Given that the Applicant is a wholly-owned subsidiary of LEGL, the Board does not believe that it is necessary to include independent directors on the Board.
2.1.3 Under section 33(1)(i) of the SFA, an RMO must ensure that it appoints or employs fit and proper persons as its chairman, chief executive officer, directors and key management officers. MAS maintains a published guide to determining whether an individual is fit and proper, the Guidelines on Fit and Proper Criteria (the "Fit and Proper Guidelines").{2} Under the Fit and Proper Guidelines, the criteria for assessing whether an individual is fit and proper include but are not limited to: (a) honesty, integrity and reputation; (b) competence and capability; and (c) financial soundness. Detailed criteria are provided under each of these three headings.
2.1.4 In addition, while the Fit and Proper Guidelines do not explicitly impose an independence standard on the directors, the requirements in the Fit and Proper Guidelines require a director to be competent and capable and, in assessing whether this standard is met, the relevant factors include "where the relevant person is an individual who is assuming concurrent responsibilities, whether such responsibilities would give rise to a conflict of interest or otherwise impair his ability to discharge his duties in relation to any activity regulated by MAS under the relevant legislation". Additionally, the Fit and Proper Guidelines underpin MAS's requirements that the directors perform their duties efficiently, honestly, fairly and act in the best interests of their stakeholders and customers.
2.1.5 The Applicant's directors are Matt Dellarocca, Timothy Turner, Quentin Miller and Lei (Ada) Yeung. No director would be considered an "independent" director under the tests in National Instrument 52-110 Audit Committees.
2.1.6 The Board provides leadership of the Applicant within a framework of prudent and effective controls. Included in its responsibilities, the Board ensures that the Applicant maintains effective control frameworks allowing it to respond to significant business, financial, compliance, and other risks to achieving its strategic objectives. The Applicant's Risk Management Committee is responsible for advising the Board and the Chief Executive Officer ("CEO") on the Applicant's various risk management activities including overall risk appetite, tolerance, current risk exposures, and maintaining the Applicant's risk register. In addition, in relation to risk assessment, the Risk Management Committee is responsible for:
(a) maintaining a framework for risk identification and quantification;
(b) regularly reviewing the parameters used in these measures and the methodology adopted;
(c) proposing risk appetite and tolerances to the Board;
(d) quantifying risks and determining appropriate risk mitigants; and
(e) reporting on the Applicant's overall risk profile to inform the Board and the CEO's decision-making.
2.1.7 The Applicant's Compliance Officer and Exchange Operations Manager review a weekly surveillance report that consists of an analysis of market and client behaviour and are responsible for escalating findings to the Applicant's Risk Management Committee for necessary remediations and reporting of suspicious transactions and/or orders to the competent regulatory authorities. The Applicant's Risk Management Committee is, in turn, accountable to the Board.
2.1.8 The Applicant established a risk framework via the various enterprise-wide risk committees in order to effectively set up a governance system to identify, mitigate and manage major risks relating to its services. The Applicant has also implemented a risk monitoring system designed to supervise the operation of each function, with respective roles and responsibilities together with an appropriate reporting for daily operations and in accordance with applicable legal and regulatory requirements.
2.1.9 The Applicant's Board may from time to time constitute and appoint committees as it may deem necessary or advisable, but has not established any committees so far. There is no regulatory requirement under Singapore law for the Board or the Applicant to establish committees.
(b) that business and regulatory decisions are in keeping with its public interest mandate,
2.1.10 The Applicant is committed to ensuring the integrity of LMAX Exchange and the stability of the financial system, and that its business and regulatory decisions align with its public interest mandate. The rules, policies and activities of the Applicant incorporate the Applicable Rules, which are designed to ensure best practices and fulfill this public interest mandate. Also, the Applicant has adopted rules surveillance systems, including the review of the weekly surveillance report, which are designed to ensure that trading by participants is conducted in a manner consistent with applicable law and to detect and prevent market manipulation and disorderly trading conditions.
(c) fair, meaningful and diverse representation on the board of directors (Board) and any committees of the Board, including:
(i) appropriate representation of independent directors, and
(ii) a proper balance among the interests of the different persons or companies using the services and facilities of the exchange,
2.1.11 Although the Applicant acknowledges the best practice and benefits of including independent directors among the Board's membership, the Applicant does not believe that it is necessary to have independent directors at this time, as the Applicant is a wholly-owned subsidiary of LEGL. In addition, MAS does not require that an RMO have any independent directors. Accordingly, all directors are employees of the Applicant, LEGL, or an LMAX Group affiliate and were appointed by LEGL.
2.1.12 The Applicant considers several factors in determining the composition of the Board, including whether directors, both individually and collectively, possess the required integrity, experience, judgment, commitment, skills and expertise to exercise their obligations of oversight and guidance over an OM. The Applicant's directors have broad experience in the financial services industry and some serve or have served as officers of various affiliates of the Applicant. The Board is responsible for approving the LMAX Group's strategy and for monitoring progress with the execution of the group's strategy against agreed targets. The Board has overall responsibility for promoting the long-term sustainable success of the LMAX Group for the benefit of its members as a whole, providing leadership and direction, including in relation to culture, ethics and values, and ensuring effective engagement with and encouraging participation from shareholders and other stakeholders. Consistent with its goal of a proper balance of interests among stakeholders, the Board strives to ensure LMAX Exchange delivers transparent price discovery and precise, consistent execution of FX NDFs to all market participants. Trading on firm limit order liquidity enables institutions to have full transparency of market dynamics and control over their execution strategy and costs and LMAX Exchange's execution model was designed specifically to treat all market participants equally regardless of status, size or activity levels. Execution services that fairly balance the interests of market participants is core to the Applicant's business and the Board is thus focused on ensuring such balance is achieved.
2.1.13 There are no term limits for directors. The Applicant does not believe it should establish term limits or mandatory retirement ages for its directors as such limits may deprive the Applicant of valuable contributions and specialized skill-sets.
(d) the exchange has policies and procedures to appropriately identify and manage conflicts of interest for all officers, directors and employees, and
2.1.14 The Board is accountable for putting a conflicts management framework in place and implementing systems, controls and procedures to identify, escalate and manage conflicts of interest. The Applicant, through its conflict of interest rules, policies and procedures, has established a robust set of safeguards designed to identify, prevent, manage and monitor actual and potential conflicts of interest, which apply to the Applicant's Board, officers and employees.
2.1.15 The Applicant's Compliance Officer is supported by LMAX Group's Legal and Regulatory department, led by its Head of Legal and Regulation. The Compliance Officer monitors against any potential conflict of interests occurring in the Applicant's business in accordance with the conflict of interests policies of LMAX Group. The Applicant's Compliance Officer submits an annual report to the Board for review of the Applicant's policy relating to the prevention of conflicts of interest, including employee conduct and any further revision or improvement to the Applicant's monitoring and control procedures.
2.1.16 The Risk Management Committee comprises of senior managers from the following departments:
• Legal and Compliance
• Liquidity Management and Analytics
• Exchange Operations; and
• Finance.
2.1.17 The duties of the Risk Management Committee include, but are not limited to, the following:
• Formulating and adopting the Applicant's risk management framework and policies impacting its risk profile.
• Advising the Board on the likelihood and the impact of principal risks materializing by recording the risks in the risk register.
• The mitigation of principal risks to reduce the likelihood of their incidence or their impact.
• Escalating risk-related matters to the Board as required.
2.1.18 The Committee oversees and seeks suitable assurance regarding:
• The risk exposures of the Applicant, including risks to the Applicant's business model, solvency and liquidity.
• Monitoring and reviewing the effectiveness of the Applicant's risk management and internal control systems.
2.1.19 Under the MAS Guidelines on Risk Management Practices (the "MAS Risk Management Guidelines"), the Applicant is recommended to have adequate policies, procedures and controls to address conflict of interest situations. The Applicant takes the view that the requirements under the SFA for the Applicant to ensure its market is fair, orderly and transparent, and manage any risks associated with its operations and business prudently, require the Applicant to have a conflicts of interest policy.
2.1.20 Accordingly, the Applicant has established a conflict of interest policy that contains arrangements to prevent actual or potential conflicts of interest. While it is the responsibility of the Applicant's compliance department to monitor against any potential conflict of interests occurring in the Applicant's business, all directors and employees are responsible for identifying and raising conflicts of interest through the appropriate channels.
2.1.21 If the Applicant identifies a conflict of interest, the Applicant will take appropriate steps to either avoid or manage such conflict. If the Applicant considers that the arrangements made by it to manage conflicts are not sufficient to ensure, with reasonable confidence, that risks of damage to the interests of a customer will be prevented, the Applicant may disclose in writing to Compliance and the customer the general nature and/or sources of conflicts of interest before undertaking business for the customer or upon identification of the conflicts.
(e) there are appropriate qualifications, remuneration, limitation of liability and indemnity provisions for directors, officers and employees of the exchange.
2.1.22 The Applicant's remuneration arrangements are aligned with its risk management framework and its key objective of providing an orderly functioning marketplace to wholesale participants for fair and transparent price discovery. The Applicant complies with the LMAX Group's Remuneration Policy, which is set by the board of LEGL in accordance with, amongst others, remuneration rules set by relevant regulators including the UK Financial Conduct Authority ("UK FCA") and the MAS. As is the case with its affiliate, LMAX Limited, which is a UK FCA regulated investment firm operating a multilateral trading facility, LMAX Exchange does not participate in any principal dealing activities in its capacity as a RMO (such activities are forbidden under MAS rules). The Applicant's remuneration arrangements are designed to support LMAX Exchange's risk-averse culture and the overall duty of LMAX Exchange to act in the best interests of its participants fairly and proportionately, and appropriately address conflicts of interest.
2.1.23 Section 8.6 of the member agreement (the "Member Agreement") of LMAX Exchange generally limits the Applicant's aggregate liability under or in connection with the Member Agreement. In addition, Section 8.7 the Member Agreement provides that "[t]he Member must indemnify and hold harmless LMAX and its Representatives against any and all Losses incurred or suffered by any of them arising out of, or in connection with: (a) a breach by the Member of any of its obligations under this Agreement or any other part of the LMAX Documents; (b) a breach by the Member of any Applicable Laws; and (c) a breach or infringement by the Member of any Intellectual Property Rights of LMAX or a third party". Furthermore, section 8.8 of the Member Agreement provides that "[t]he Member must indemnify, protect and hold harmless LMAX, its Affiliates, and their respective Representatives from and against any and all Losses resulting from or arising out of any claim asserted against LMAX by any party for whom the Member acts or purports to act (including any asserted breach of fiduciary duty) in relation to the LMAX Services provided to the Member in accordance with this Agreement."
2.1.24 See the preceding paragraphs above for information on the Applicant's Board members' qualifications. Members of the Applicant's management team are recruited for their particular position based upon their skills and expertise.
2.2 Fitness -- The exchange has policies and procedures under which it will take reasonable steps, and has taken such reasonable steps, to ensure that each director and officer is a fit and proper person and past conduct of each officer or director affords reasonable grounds for belief that the officer or director will perform his or her duties with integrity.
2.2.1 Responsibility lies with the Applicant to satisfy itself that the relevant individual is fit to perform the role applied for. Also, see the description of Board composition and information on the Applicant's director qualifications above.
3.1 Review and Approval of Products -- The products traded on the exchange and any changes thereto are submitted to the Foreign Regulator, and are either approved by the Foreign Regulator or are subject to requirements established by the Foreign Regulator that must be met before implementation of a product or changes to a product.
3.1.1 As an RMO operator, the Applicant requires specific authorisation from the MAS to offer the LMAX Exchange in respect of each type of financial instrument traded on the LMAX Exchange.
3.1.2 Under section 41 of the SFA, RMOs are required to notify the MAS before proceeding with the launch of "relevant products" (as defined in section 41(8) of the SFA). In this regard, MAS Notice SFA 02-N01 sets out the ongoing notification requirements relating to the listing, delisting or trading of relevant products on the RMOs' OM.
3.1.3 The specific authorisation required under section 41 of the SFA and MAS Notice SFA 02-N01 is effected via a certification to the MAS, which assesses, among other things, whether: (a) the underlying interest of the proposed instrument has all the elements of economic utility or offers economic benefits to market participants, (b) there is a probable and significant operational risk to the RMO arising from facilitating the trading of the instrument type, (c) the way the RMO facilitates the trading of the instrument type will not impact the ability of the RMO to continue to satisfy its obligations under the SFA to maintain fair, orderly and transparent functioning of the market, and (d) the RMO has powers to take actions against errant members who engage in market misconduct activities, such as market manipulation.
3.1.4 MAS approval is required, and has been granted, for the Applicant to make available for trading on the LMAX Exchange FX NDFs. No further MAS approval is required to change, suspend, or remove such instruments, although maintenance of such instruments on LMAX Exchange requires an annual assessment and certification to MAS.
3.1.5 RMOs are required to notify the MAS that they have established appropriate controls and governance procedures to adequately address the key risks pertaining to relevant products, namely:
(a) the risk of disorderly trading that may be brought about by a sharp change in prices;
(b) the risk of persons acquiring significant amounts of the product which facilitates the ability of those persons to gain from market manipulation; and
(c) the legal, operational and reputational risks surrounding the product.
3.1.6 As discussed in Section 3.1.2 above, the Applicant must submit a certification to MAS with respect to the trading of new types of financial instruments on LMAX Exchange, which includes a risk assessment of such contracts. Please also see Section 2.1.6 for an overview of the Board's role on risk oversight. The certification must be re-submitted to MAS on an annual basis.
3.1.7 The MAS has powers under section 45 of the SFA to take action if RMOs fail to provide appropriate controls and governance procedures, including imposing higher supervisory capital, requiring an independent audit on specific processes and prohibiting the listing of new products. The MAS may issue a notice in writing under section 46 of the SFA to a RMO to prohibit trading in products if the MAS is of the opinion that it is necessary to protect persons buying or selling such financial instruments.
3.1.8 The Applicant is currently authorised by the MAS to offer LMAX Exchange in relation to FX NDFs. To the extent the Applicant wishes to make available for trading additional classes of financial instruments on LMAX Exchange, it would require prior MAS approval and expansion of the Applicant's RMO license.
3.2 Product Specifications -- The terms and conditions of trading the products are in conformity with the usual commercial customs and practices for the trading of such products.
3.2.1 As part of the Applicant's RMO authorization from the MAS, the Applicant identified the type of instruments that it intended to make available for trading on the OM. The MAS has authorised the Applicant to provide trading and matching services in respect of FX NDFs. As provided for in the RMO Rulebook, the instruments that LMAX Exchange participants may trade are listed on the following webpage: www.lmax.com/exchange/fx-ndfs.
3.2.2 The MAS's requirements for authorization of RMOs do not make reference to usual commercial customs and practices. Instead, the Applicable Rules focus on maintaining and implementing transparent and non-discriminatory rules, based on objective criteria. The RMO Rulebook is drafted in accordance with these criteria, which aims to give participants a clear understanding of the lifecycle of a trade. It is the Applicant's experience that the terms and conditions of the instruments that trade on LMAX Exchange are generally accepted and understood by participants.
3.3 Risks Associated with Trading Products -- The exchange maintains adequate provisions to measure, manage and mitigate the risks associated with trading products on the exchange that may include, but are not limited to, daily trading limits, price limits, position limits, and internal controls.
3.3.1 Under subsection 35(1) of the SFA, an RMO must ensure that the systems and controls concerning the assessment and management of risks in respect of every OM that the RMO operates are adequate and appropriate for the scale and nature of its operations, and is liable to a fine for failure to do so.
3.3.2 The Applicant's Compliance and Market Operations teams are responsible for a range of surveillance alerts that run in the system on a real-time basis, each of which monitors for different trading scenarios and behaviours, against parameters set for each instrument. The surveillance alerts cover activities such as: "painting the tape", "price ramping", wash trading and prearranged trading and seek to identify and prevent violations of LMAX Exchange rules, manipulation, price distortion, disorderly trading conditions and conduct that may involve market abuse, as required by the MAS, and to maintain a safe and orderly marketplace with healthy and stable liquidity.
3.3.3 The Applicant will carry out surveillance on Ontario Participants once the Requested Relief is granted by the Commission.
3.3.4 Consistent with other RMOs, the Applicant will comply with any position limits or other limits established by the MAS, as applicable, if and when any such limits are communicated to the Applicant. The Applicant has implemented the following venue controls to ensure orderly functioning of its markets: volatility banks, inversion protection, order throttling, pre-trade controls, working order limits, post trade controls, a kill switch, a trade cancellation / re-rate policy in accordance with the LMAX Exchange RMO Rule Book and venue capacity. These venue controls also apply to DMA Clients. The Applicant is not involved in the settlement portion of the trade.
4.1 Fair Access
(a) The exchange has established appropriate written standards for access to its services including requirements to ensure
(i) participants are appropriately registered as applicable under Ontario securities laws, or exempted from these requirements,
(ii) the competence, integrity and authority of systems users, and
(iii) systems users are adequately supervised.
(b) The access standards and the process for obtaining, limiting and denying access are fair, transparent and applied reasonably.
(c) The exchange does not unreasonably prohibit, condition or limit access by a person or company to services offered by it.
(d) The exchange does not
(i) permit unreasonable discrimination among participants, or
(ii) impose any burden on competition that is not reasonably necessary and appropriate.
(e) The exchange keeps records of each grant and each denial or limitation of access, including reasons for granting, denying or limiting access.
4.1.1 Section 33(1)(a) of the SFA requires the Applicant, in so far as is reasonably practicable, to ensure that it operates LMAX Exchange as a fair, orderly and transparent OM, which is characterised by non-discriminatory access to market facilities and information.
4.1.2 Pursuant to section 33(1)(d) of the SFA, the Applicant must ensure that access for participation in its facilities is subject to criteria that are (i) fair and objective, and (ii) designed to ensure the orderly functioning of its OM and to protect the interests of the investing public. Pursuant to section 33(1)(h) of the SFA, the Applicant must maintain governance arrangements that are adequate for its OM to be operated in a fair, orderly and transparent manner.
4.1.3 Participant status, access to, and usage of, LMAX Exchange is available to all market participants that meet the criteria set forth by the Applicant. The Applicant vets prospective participants against the Applicant's eligibility criteria as part of its participant onboarding procedures.
4.1.4 Specifically, for a participant to trade FX NDFs on LMAX Exchange, the participant must be a Bank Member or a DMA Client of a Bank Member. All applicants to become "Bank Members" admitted to trade NDFs on LMAX Exchange, either to trade on their own account or to execute orders on behalf of clients must satisfy certain Core Membership Criteria and Additional Membership Criteria.
4.1.5 Pursuant to the Core Membership Criteria set out in Rule 5 (Membership) of the RMO Rulebook, an applicant to become a Member must:
(a) enter into a Member Agreement (as defined in the RMO Rulebook);
(b) be an institutional investor, professional investor, accredited investor or expert investor as defined in the SFA if incorporated or established in Singapore;
(c) be authorised as a Banking Institution or an Investment Firm (each as defined in the RMO Rulebook) except where it does not need to be authorised to carry on trading activities on LMAX Exchange;
(d) in the view of the Applicant;
(i) be of sufficient good repute;
(ii) have sufficient levels of trading ability, competence and experience;
(iii) have adequate governance and organisational arrangements to oversee its trading activities and to ensure compliance with the RMO Rulebook and applicable laws;
(iv) have sufficient resources for the trading activities it intends to undertake; and
(v) if executing orders for clients, have appropriate permission from its regulator to trade on own account and execute orders on behalf of clients.
4.1.6 Pursuant to the Additional Membership Criteria set out in Rule 24 (Additional Membership Criteria for trading NDFs) of the RMO Rulebook, a Bank Member applicant must:
(a) be a Banking Institution or third country bank or any of their affiliates, a central bank or specified international institution;
(b) (except if it is a central bank) be a "Settlement Member" or "Third-Party Bank Member" of the service for settling FX provided by CLS Bank International;
(c) have a qualifying master trading agreement with the matching Bank Member or a Settlement Bank under which it may enter into NDFs resulting from use of the LMAX Exchange service for NDFs.
4.1.7 A "DMA Client" is defined under the RMO Rulebook as any Client of a Member accessing LMAX Exchange via direct market access ("DMA") and who has entered into a DMA agreement with a Member and a user agreement with the Applicant. Rule 6.2 of the RMO Rulebook requires Members to ensure that each DMA Client:
(a) be an institutional investor, professional investor, accredited investor or expert investor as defined in the SFA if incorporated or established in Singapore;
(b) be of sufficient good repute;
(c) have sufficient levels of trading ability, competence and experience;
(d) have adequate governance and organisational arrangements to oversee their trading activities;
(e) have sufficient resources for the trading activities they intend to undertake; and
(f) comply with Rule 7 (Governance), Rule 8 (Systems), Rule 9 (Access), Rule 10 (Confidentiality), Rule 11 (Data Protection), Rule 15 (Algorithmic Trading), Rule 17 (Reporting and Taxes), Rule 18 (Market Integrity) and such other rules under the RMO Rulebook compliance with which by them, the relevant Member is responsible.
4.1.8 Rule 6.3 of the RMO Rulebook provides that Members must ensure that DMA Clients adhere to the rules contained in the RMO Rulebook in respect of orders submitted to, and transactions executed on, LMAX Exchange. Rule 6.4 of the RMO Rulebook further provides that each Member must enable the Applicant to identify uniquely on an anonymous basis each of its clients using Direct Market Access or a similar functionality. Each Member must apply a separate limit to each of its DMA Clients.
4.1.9 All Ontario Participants that are Bank Members will be required to be banks listed on Schedule I, II or III of the Bank Act (Canada) or otherwise satisfy all of the Core Membership Criteria and Additional Membership Criteria.
4.1.10 In addition, all Ontario Participants will be required (i) to be registered under Ontario securities laws, exempt from registration or not subject to registration requirements, and (ii) to immediately notify the Applicant if it ceases to meet such criteria. The Applicant's onboarding process for Ontario Participants will include, a participant due diligence process, requiring a prospective Member/DMA Client to provide details of its regulatory status, and obtaining representations and warranties with respect to the Ontario Participant's registration status. LMAX Exchange will take reasonable steps to verify these representations as part of its onboarding process.
4.1.11 The Applicant may suspend or end a Member's membership with immediate effect if, among other things, the Member does not satisfy the eligibility criteria listed above, the Applicant believes it to be in the best interest of the relevant service of the Applicant to do so or MAS requires the Applicant to do so.
4.1.12 A Member may appeal any decision taken by the Applicant to suspend or terminate its membership in certain circumstances. The appeal must be made in writing and submitted to the Applicant within ten business days of the effective date of the Applicant's notice, giving its reasons for appealing and any information relevant to the appeal. A senior manager of the Applicant carrying out the compliance oversight function will consider an appeal.
5.1 Regulation -- The exchange has the authority, resources, capabilities, systems and processes to allow it to perform its regulation functions, whether directly or indirectly through a regulation services provider, including setting requirements governing the conduct of its participants, monitoring their conduct, and appropriately disciplining them for violations of exchange requirements.
5.1.1 As required by the SFA, the RMO Rulebook sets out transparent and non-discretionary rules and procedures for fair and orderly trading by participants. Participants are required to comply with a significant number of rules that govern the trading on LMAX Exchange. The applicable rules are primarily located in Rule 14 (Orders), Rule 25 (Currency Pairs), Rule 26 (Trade formation), Rule 27 (NDF Settlement Limits for NDF trading on LMAX Exchange) and Rule 28 (Liquidity Protection Rule for LMAX Exchange Services) of the RMO Rulebook which is provided to each participant upon onboarding to LMAX Exchange.
5.1.2 The Applicant is dedicated to safeguarding the integrity of LMAX Exchange, and has policies and procedures that are designed to ensure that LMAX Exchange is free from manipulation and other abusive practices. These efforts are a necessary component of efficiently working markets, and the Applicant is committed to ensuring that participants are able to use LMAX Exchange with the knowledge that it remains open and transparent.
5.1.3 Further, the RMO Rulebook, which govern participation in the Applicant's platform, provides that participants must not engage in offences under Part 12 of the SFA and/or, in relation to non-deliverable forward FX contract transactions, contrary to Principle 12 of the FX Global Code; enter into or engage in wash trades, front running and disruptive trading practices, commit any act or engage in any course of conduct which is likely to damage the fairness, integrity, proper functioning or orderliness of LMAX Exchange or the provision of any service of the LMAX Exchange; or bring LMAX into disrepute. If the Applicant were to detect that a participant was in breach of this obligation under the RMO Rulebook, the Applicant would have remedies available to it under Rule 19 (Monitoring and reporting) and Rule 20 (Suspension and termination of membership) of the RMO Rulebook.
5.1.4 The Applicant's Compliance and Market Operations teams are responsible for a range of surveillance alerts that run in the system on a real-time basis, each of which monitors for different trading scenarios and behaviours, against parameters set for each instrument. The trade surveillance system is capable of detecting potential market abuse scenarios and violations of the RMO Rulebook. The real-time trade surveillance system has the capability to detect and flag specific trade patterns and trade anomalies, compute, retain, and compare trading statistics, reconstruct the sequence of market activity, perform market analyses to perform in-depth analyses and ad hoc queries of trade and order-related data.
5.1.5 The Applicant performs anti-money laundering and counter-terrorist finance checks as part of its participant onboarding procedures. Where there are reasonable grounds to suspect or where there is a suspicion of money laundering or terrorist financing which the Applicant becomes aware of in the course of participant's activities on LMAX Exchange, this will be reported to the Suspicious Transaction Reporting Office of Singapore, which investigates and reports money laundering, terrorist financing and related offenses to the relevant law enforcement and investigative services, and to other relevant regulators as required by applicable regulation (including the MAS).
5.1.6 The Applicant has a range of tools for enforcing participants' compliance with the RMO Rulebook. These tools include issuing written warning letters, temporarily suspending access or terminating a participant's ability to access LMAX Exchange.
5.1.7 If the Applicant's Compliance and Market Operations teams identify a breach of LMAX Exchange rules or signs of market abuse or manipulation resulting from client trading behaviour, it will (i) escalate findings to the Applicant's Risk Management Committee for necessary remediations and reporting of suspicious transactions and/or orders to the competent regulatory authorities (ii) and include such information in a report to senior management.
5.1.8 The Applicant has not issued any warning letters, final warnings or suspensions pursuant to the RMO Rulebook in the 12-month period preceding January 2024. The RMO Rulebook under which such letters, final warnings or suspensions would be issued was not in effect until November 2023, coinciding with the launch date of LMAX Exchange.
5.1.9 Pursuant to Notice CMG-N01 -- Reporting of Suspicious Activities and Incidents of Fraud, the Applicant will report to the MAS any suspicious activities and incidents of fraud where such activities or incidents are material to its safety, soundness or reputation. The MAS has the power to investigate and impose unlimited fines for market abuse, and to prosecute for market manipulation. A participant may be referred to a regulator in another jurisdiction with which the MAS has entered into a memorandum of understanding.
6.1 Purpose of Rules
(a) The exchange has rules, policies and other similar instruments (Rules) that are designed to appropriately govern the operations and activities of participants and do not permit unreasonable discrimination among participants or impose any burden on competition that is not reasonably necessary or appropriate.
6.1.2 Pursuant to its obligations under the Applicable Rules, the Applicant has implemented rules, policies and procedures that are designed to not permit unreasonable discrimination among participants or impose unreasonable or unnecessary burdens on competition. The Applicant's rules are covered in the RMO Rulebook. The Applicant believes that its rules and policies that govern the activities of participants are consistent with the rules and policies of other marketplaces, and therefore do not impose any burden on competition that is not reasonably necessary or appropriate.
(b) The Rules are not contrary to the public interest and are designed to
(i) ensure compliance with applicable legislation,
(ii) prevent fraudulent and manipulative acts and practices,
(iii) promote just and equitable principles of trade,
(iv) foster co-operation and co-ordination with persons or companies engaged in regulating, clearing, settling, processing information with respect to, and facilitating transactions in the products traded on the exchange,
(v) provide a framework for disciplinary and enforcement actions, and
(vi) ensure a fair and orderly market.
6.1.3 The RMO Rulebook is subject to the standards and requirements outlined by the Applicable Rules. At a high level, the RMO Rulebook seeks to ensure fair and orderly markets accessible to all eligible Members that meet the criteria listed in Rule 5 and Rule 24 of the RMO Rulebook and DMA Clients that meet the criteria listed in Rule 6 of the RMO Rulebook. This aim is accomplished by establishing rules that reflect the Applicable Rules, criteria that are not contrary to the public interest, and are designed to:
(i) ensure compliance with applicable legislation. Rule 5 (Membership) and Rule 24 (Additional Membership Criteria for trading NDFs) of the RMO Rulebook governs Member requirements. Rule 6 (Direct Market Access) of the RMO Rulebook governs DMA Client requirements.The Applicant is obligated to comply with MAS rules, and must implement rules that require compliance with MAS rules by its participants. The Applicant will proactively monitor its participants' compliance with applicable law and regulation, evidenced in part by its market surveillance systems designed to identify market abuse and prevent disorderly trading conditions.
(ii) prevent fraudulent and manipulative acts and practices. Rule 18 (Market Integrity) of the RMO Rulebook prescribes prohibited trading activities, and prohibits abusive, misleading and disruptive activity. The Applicant has instituted procedures to collect information, examine participants' records, directly supervise the market, maintain sufficient compliance staff, conduct audit trail reviews, perform real-time market monitoring and market surveillance and establish an automated trade surveillance system.
(iii) promote just and equitable principles of trade. All systems of LMAX Exchange are available to all participants on a non-discriminatory basis. Throughout the RMO Rulebook, the Applicant has established transparent and objective standards for access to and trading on LMAX Exchange to foster competitive and open market participation. The Applicant believes that compliance with the RMO Rulebook and related compliance procedures promote just and equitable principles of trade.
(iv) foster co-operation and co-ordination with persons or companies engaged in regulating, clearing, settling, processing information with respect to, and facilitating transactions in the products traded on the exchange. Subject to applicable laws, Rule 19.2 (Cooperation with the regulator) of the RMO Rulebook authorizes the Applicant to provide assistance and information to the MAS, and any other regulatory authority (e.g., the Commission), in connection with any investigation and prosecution of or enforcement action regarding any actual or suspected prohibited trading practice on LMAX Exchange. Each participant is also required by Rule 19.2 to co-operate, to the fullest extent permitted by applicable laws, with the Applicant and any governmental authority in any investigation, proceeding or enquiry in relation to the Applicant and/or the services of LMAX Exchange.
Rule 10.3 (Permitted Disclosures) also authorizes the Applicant to disclose any confidential information if obliged to do so in order to comply with applicable laws, including following the request from any competent court, regulator or governmental authority.
(v) promote a framework for disciplinary and enforcement actions. Under Rule 20.2 (Conditions for Suspension and termination by LMAX) of the RMO Rulebook, the Applicant may suspend or end a Member's membership with immediate effect if (a) the Member fails to pay fees and/or charges within 30 days of the due date; (b) an insolvency event happens in relation to the Member; (c) the Member does not trade on a particular LMAX Exchange service for six months; (d) the Member does not satisfy the membership criteria of the Applicant; (e) LMAX reasonably believes that the Member has breached the RMO Rulebook; (f) the Applicant's senior manager carrying out the compliance oversight function of the LMAX Exchange finds that the Member has breached a rule and recommends suspension or termination; (g) the Applicant believes it is in the best interest of the relevant LMAX Exchange service to do so; (h) the Member is an entity licensed or authorised by the MAS, where its licence or authorisation is revoked by the MAS; or (i) required upon the direction of the MAS. On completing an investigation under Rule 19 (Monitoring and reporting) of the RMO Rulebook, the senior manager of the Applicant carrying out the compliance oversight function may suspend or terminate the Member's ability to provide direct market access to any DMA Client.
(vi) ensure a fair and orderly market. The Applicant prescribes trading rules, collects and evaluates market activity data, maintains and audits its real-time monitoring program, and audits historical data to detect trading abuses. The Applicant periodically reviews its programs and procedures, including risk analysis, emergency planning, and systems testing. The Applicant regularly audits systems and technology tests both for technical and regulatory compliance. LMAX Group's Compliance Department has the capability to suspend all trading on LMAX Exchange during emergency situations. The Compliance Department also has the ability to suspend trading of specific instruments or instruments of a specific asset class during a trading day, either in response to an emergency situation or by order of a regulator. The Applicant believes that these measures and its rules are designed to ensure a fair and orderly market.
7.1 Due Process -- For any decision made by the exchange that affects a participant, or an applicant to be a participant, including a decision in relation to access, exemptions, or discipline, the exchange ensures that:
(a) parties are given an opportunity to be heard or make representations, and
(b) it keeps a record of, gives reasons for, and provides for appeals or reviews of its decisions.
7.1.2 The Applicant may prevent a person from becoming a LMAX Exchange participant, if in the Applicant's sole discretion, the person does not satisfy the eligibility criteria listed in Section 4. Under Rule 20.2 (Conditions for Suspension and termination by LMAX) of the RMO Rulebook, without prejudice to any other rule, the Applicant may also suspend or end a Member's membership for any of the circumstances, violations or events listed in Rule 20.2(a)-(i).
7.1.3 A Member may complain in writing about other Members to the senior manager of the Applicant carrying out its compliance oversight function who will commence an investigation in accordance with Rule 19.4 (Investigation) of the RMO Rulebook if he considers the complaint to be substantive. Complaints about the Applicant may be made in writing to such senior manager for investigation. On completing an investigation under Rule 19 (Monitoring and reporting), the senior manager of the Applicant carrying out the compliance oversight function may: (i) do nothing; (ii) issue a written warning; or (iii) recommend that the Applicant suspends or terminates the member's membership; (iv) suspend or terminate the member's ability to provide direct market access to any DMA Client.
7.1.4 Furthermore, a Member may appeal any decision by the Applicant to suspend or terminate its membership on the basis of paragraph (d) to (g) of Rule 20.2 (Conditions for Suspension and termination by LMAX) of the RMO Rulebook to the Applicant's senior manager carrying out its compliance oversight function. The appeal must be made in writing and submitted to LMAX within ten business days of the effective date of the Applicant's notice under Rule 20.3 (Notice) of the RMO Rulebook. The Member will give reasons for appealing the Applicant's decision and provide any information relevant to the appeal. If the Applicant has decided to suspend or end a membership and a Member appeals, its membership shall remain suspended in accordance with the Applicant's decision or ended unless and until the such senior manager carrying out LMAX Exchange's compliance oversight function has allowed the appeal. The Applicant keeps a record of, and gives reasons for, any decision made by the Applicant that affects a participant or an applicant to be a participant, including a decision in relation to access, exemptions, or discipline.
7.1.5 If a participant's access is terminated, the Applicant will comply with its regulatory obligations and supply data and information to the MAS when required, and will assist the MAS in any investigation conducted regarding trading on LMAX Exchange.
8.1 Clearing Arrangements -- The exchange has or requires its participants to have appropriate arrangements for the clearing and settlement of transactions for which clearing is mandatory through a clearing house.
8.1.1 Neither the Applicant nor any of its affiliates acts as a counterparty or takes title to, or provides execution, clearing, settlement or custodial facilities to participants for, any OM Instrument traded on LMAX Exchange. LMAX Exchange participants must comply with any clearing obligation that applies to them under applicable law, including the laws of the province of Ontario. The Applicant has no direct connection to any clearing agencies in relation to any OM Instrument traded on LMAX Exchange.
8.1.2 Participants are solely responsible for ensuring the prompt exchange and processing of confirmations directly with their counterparties in accordance with market practice. With respect to settlement, participants are solely responsible for the post-trade settlement of all transactions that are negotiated on LMAX Exchange bilaterally. With respect to clearing, if participants are required by applicable regulation or choose to clear a transaction, they are solely responsible for making the necessary arrangements under the RMO Rulebook.
8.1.3 Participants must have either: an ISDA Master Trading Agreement with all the other Bank Members of the LMAX Exchange whose trades are capable of being matched with the participant; or an ISDA Master Trading Agreement with at least one of the Settlement Bank Members (as defined in section 23 of the RMO Rulebook) who carry out credit intermediation of trades for the LMAX Exchange, and to whom the participant will give up its leg of the trade for clearing and settlement by the settlement member. Each settlement member is also a Bank Member of the LMAX Exchange.
8.2 Risk Management of Clearing House -- The exchange has assured itself that the clearing house has established appropriate risk management policies and procedures, contingency plans, default procedures and internal controls.
8.2.1 This item is not applicable as the OM Instruments are not centrally cleared.
9.1 Systems and Technology -- Each of the exchange's critical systems has appropriate internal controls to ensure completeness, accuracy, integrity and security of information, and, in addition, has sufficient capacity and business continuity plans to enable the exchange to properly carry on its business. Critical systems are those that support the following functions:
(a) order entry,
(b) order routing,
(c) execution,
(d) trade reporting,
(e) trade comparison,
(f) data feeds,
(g) market surveillance,
(h) trade clearing, and
(i) financial reporting.
9.1.1 LMAX Exchange has appropriate internal controls (that cover all of the critical systems that support functions (a) to (i) listed in Section 9.1 above) designed to provide for completeness, accuracy, integrity and security of information, and, in addition, have sufficient capacity and a business continuity plan to enable LMAX Exchange to properly carry on their businesses.
9.1.2 The Applicant has put safeguards in place to protect the critical data and system components of its LMAX Exchange and reduce the potential risk of market disruptions, including but not limited to market restrictions that could pause or halt trading under market conditions prescribed by the Applicant.
9.1.3 The Applicant operates and provides to participants a robust and scalable platform. Standard system monitoring metrics include capacity and performance level alerts. In addition to system level monitoring of capacity and performance of resources, the Applicant also conducts standardized application or platform capacity tests on a regular basis. This ensures the platform is well positioned to provide adequate responsiveness to customers. The data generated from these tests are used to establish present and historical bench-marks to identify performance and/or capacity hot spots or deficiencies. Additional re-sources are deployed where appropriate to resolve performance or capacity issues out-side of the benchmark to bring performance back in line with benchmark expectation.
9.1.4 LMAX Exchange makes capacity estimates by regularly monitoring its systems usage as well as maintaining constant communications between internal parties whenever new business or possible changes in the market may increase capacity on the systems.
9.1.5 The Applicant conducts regular performance and capacity tests in a production test environment which matches production in its size, scope and infrastructure.
9.1.6 LMAX Group maintains its IT systems to be designed and implemented to achieve the level of system availability provided for under its business continuity plan and aligned with the ISO 22301:2019 (security and resilience) framework. LMAX Group is also compliant with and certified to ISO 27001:2013 (information technology).
9.2 System Capability/Scalability -- Without limiting the generality of section 9.1, for each of its systems supporting order entry, order routing, execution, data feeds, trade reporting and trade comparison, the exchange:
(a) makes reasonable current and future capacity estimates;
9.2.1 The Applicant examines current and historical production loads on LMAX Exchange to calculate reasonable current and future capacity estimates.
(b) conducts capacity stress tests to determine the ability of those systems to process transactions in an accurate, timely and efficient manner;
9.2.2 The Applicant supervises and conducts periodic stress testing of system components, which are designed to ensure that its systems have sufficient capacity to perform required operational tasks. The Applicant evaluates and monitors capacity requirements to anticipate capacity need.
(c) reviews the vulnerability of those systems and data centre computer operations to internal and external threats, including physical hazards and natural disasters;
9.2.3 See the response to clause (d) below.
(d) ensures that safeguards that protect a system against unauthorized access, internal failures, human errors, attacks and natural catastrophes that might cause improper disclosures, modification, destruction or denial of service are subject to an independent and ongoing audit which should include the physical environment, system capacity, operating system testing, documentation, internal controls and contingency plans;
9.2.4 LMAX Group's Information Security Policy ("ISP") sets out comprehensive information security measures. The ISP's purpose is to safeguard the confidentiality, integrity, and availability of the company's information and services through a structured program designed and operated to mitigate information security risks and threats to LMAX Group. LMAX Group's internal compliance controls relating to information security are underpinned by the following two key industry standards:
• ISO 27001:2013 A.5.1 -- Information Security Policies
• SOC 2 Common Criteria 3.1 -- Complies with Frameworks
9.2.5 LMAX Group's information security framework as set out in the ISP has received endorsement from the Board and its senior management, which is representative of the leadership's commitment to the following Information Security objectives:
• Implementing and maintaining certified management systems and organisational standards that uphold the integrity of business services and the systems approach: SOC 1 & 2, ISO 27001:2013;
• Satisfying legal and applicable requirements including contractual obligations;
• Continually improving the management system, its policies and processes;
• Managing information and cyber security risks across LMAX Group;
• Ensuring responsibilities and authorities for information security are assigned and communicated;
• Reviewing the ISMS components on a periodic basis to ensure outputs remain compliant and acting on the outputs of nonconformities;
• Holding leadership and senior management teams accountable;
• Testing and improving resilience through backup reviews and business continuity testing; and
• Performing regular information security related training for all staff.
9.2.6 The Applicant outsources the provision of ancillary technological and operational support functions to its LMAX Group affiliate, LMAX Limited (a private limited company organized under the laws of England and Wales), acting as the operator of LMAX Exchange and LMAX MTF. See the responses in Section 14 below.
9.2.7 On very rare occasions, LMAX Group's facilities have experienced technical outages. In each case, the applicable LMAX Group entities have conducted post-incident reviews to seek a thorough understanding of the technology processes that led to the incident.
9.2.8 LMAX Limited's production platform is designed to be resilient with multiple redundant instances of all components. In the event of a failure of a single component, a secondary component will recognise the failure and take over as necessary. The hardware also operates with uninterruptable power supply and backup generators to ensure temporary electricity failures can be comfortably handled.
9.2.9 LMAX Limited has staff focused solely on site reliability, performance and stability with respect to LMAX Exchange and other LMAX Group facilities. This is a preventative measure which also continually improves their diagnostic capabilities and recovery in the case of a failure.
9.2.10 LMAX Exchange employs monitoring tools to validate key areas of its systems. LMAX Group invests resources on an ongoing basis to improve these monitoring solutions.
9.2.11 LMAX Limited develops its own software that is used in LMAX Exchange and other LMAX Group facilities. All new codes are tested thoroughly prior to release into production. The testing process involves over thirty thousand regression tests in dedicated test and staging environments. These are designed to mimic the production environment to the greatest possible extent. Testing is also carried out in the production environment while the markets are open in a data segregated virtual venue. The configuration of all environments is strictly controlled and all software deployment including roll-back and fail-over is accomplished through formal, repeatable processes that are largely automated. Similarly, any data migration that is required is accomplished through software that is itself also subject to rigorous testing.
(e) ensures that the configuration of the system has been reviewed to identify potential points of failure, lack of back-up and redundant capabilities;
9.2.12 LMAX Group has developed a data loss prevention policy and adopted the following measures to foster data-security.
9.2.13 Business Continuity
9.2.14 LMAX Group aligns its Business Continuity approach with ISO 22301: 2019 framework. LMAX Group is compliant with and certified to ISO 27001: 2013.
9.2.15 LMAX Group has implemented a business continuity planning and testing programme to complement the disaster recovery controls. Six monthly external audits take place to ensure the business continuity is aligned to the needs and expectations of internal and external stakeholders.
9.2.16 LMAX Group's BCP (as defined below) is similarly tested and audited on an annual basis. In the event of a business continuity event being declared, there is a documented process for escalation and redeployment of business functions to staff in other countries or to resume functionality via remote working.
9.2.17 Data Availability
• No single point of failure designs (NSPOF). Highly available data stores use active clustering with real time replication to ensure access to data in the event of hardware failure. Disaster recovery/business continuity sites act as secondary data stores using active passive design with real time replication.
• Archived personal data is encrypted before being transported for off-site storage. These backups are restored periodically to ensure successful recovery is possible.
• Infrastructure as code ensures servers are built and configured in a consistent, high availability design.
• Continuous development pipeline consisting of over 50,000 automated tests that assess measures put in place for confidentiality, integrity and high availability continue to function as expected.
• Regular backups are performed, encrypted and stored off-site.
9.2.18 Transmission Controls
• Data loss prevention is in place for email and Internet access for all users handling sensitive data.
• Encryption of personal data during transmission is achieved through modern cryptographic protocols, which provides effective protection against interception by a third party.
• Anonymized personal data is sent to any environment considered less secure or where it is not needed.
9.2.19 Admissions Controls
• Reviews and audits are conducted periodically with the aim of ensuring that the policies, controls, and measures in place remain effective and fit for purpose.
• Physical access to data centres requires biometric authentication.
• Role-based access control is in place to protect sensitive data and following the principle of least privilege. Each employee can belong to only one role, which determines what permissions are granted. Users are authorised to perform only the tasks they need to perform according to their role.
• Due diligence is performed on data processors to ensure they can demonstrate appropriate technical and organisational measures to protect data, before putting in place written contracts.
9.2.20 LMAX Group has outlined its security standards for its hardware and software to minimise its exposure to cyber threats. These are reviewed and updated periodically:
• Multi-factor authentication in place using Duo Security. Yubikey hardware tokens are also used.
• LMAX Group makes use of four distinct security zones, each within their own authentication realm. Each of these security zones is isolated from the others via the use of two-factor authentication (2FA), bastion hosts and physically separate authentication systems that use different authentication technology stacks. This approach increases the work factor for lateral movement, increasing chances of detection.
• Within each security zone, traffic from each subnet must first traverse through firewalls and intrusion detection systems where access is controlled and monitored.
• Private virtual local area networks (VLANS) are used in all office locations, preventing direct communications between user desktops forcing traffic to first go through a firewall.
• Anti-virus and endpoint detection and response (EDR) tooling deployed and kept up to date to regularly scan systems.
(f) maintains reasonable procedures to review and keep current the development and testing methodology of those systems; and
9.2.21 The Applicant reviews and keeps current development and testing methodologies for its systems in accordance with relevant policies and procedures. To identify and control the risks related to system development projects, a set of processes are implemented and include obtaining the necessary approvals for planning, designing, development, testing, and deploying information systems.
(g) maintains reasonable back-up, contingency and business continuity plans, disaster recovery plans and internal controls.
9.2.22 LMAX Group has developed a comprehensive business continuity framework to ensure its compliance with applicable regulatory obligations, support the company's strategic business objectives, including to improve consumer and client protection and service quality satisfaction and mitigate against cyber-security and other infrastructure related risks as well as premises risks.
9.2.23 The Business Continuity Policy ("BCP") is an in-depth policy that serves to mitigate potential impacts to LMAX Group's markets (including LMAX Exchange's), customers, assets and employees, and to safeguard the effective availability of essential products and services. BCP plans for the unavailability of site, staff and systems, and as a result, is designed to withstand a variety of adverse scenarios. BCP is designed to be agile and quickly responds to events to minimize impacts to LMAX Group's lines of business.
9.2.24 The Applicant's back-up and disaster recovery procedures and capabilities are maintained in accordance with LMAX Group's BCP.
9.2.25 LMAX Group has established a system and data backup strategy and developed a plan to perform regular backups so systems and data can be recovered in the event of a system disruption. The plan includes the following procedures:
• Periodically test the restoration of the LMAX Group system and data backups.
• Protect data in backup from unauthorised access and modification by ensuring any confidential data stored in the backup media is secured.
9.3 Information Technology Risk Management Procedures -- The exchange has appropriate risk management procedures in place including those that handle trading errors, trading halts and respond to market disruptions and disorderly trading.
9.3.1 The Applicant has set out appropriate risk management procedures, including those that handle trading errors, trading halts and respond to market disruptions and disorderly trading, in the RMO Rulebook, including:
(a) Rule 15.2: Participants must test each algorithm notified to the Applicant in Applicant's testing environment so that in Applicant's opinion it will not result in disorderly trading conditions on any LMAX Exchange service.
(b) Rule 14.5: The Applicant will reject orders outside its volatility band and send a rejection message to the Member who placed the order.
(c) Rule 13.1: The Applicant may suspend the entry of orders in respect of any LMAX contract at any time if: (i) required to do so by applicable laws, (ii) requested to do so by a governmental authority or (iii) the Applicant reasonably believes that the participant has breached the RMO Rulebook.
(d) Rule 13.3: The Applicant may use the "kill functionality" (i.e., the ability to cancel unexecuted orders) in the following conditions: on the request of a Member if the Member or its DMA Client is technically unable to delete that order; (b) if it duplicates another order on LMAX Exchange in error; or (c) which was submitted and remained unfilled before a suspension in accordance with the RMO Rulebook.
(e) Rule 26.1: The Applicant may refuse to accept an NDF order or cancel any NDF order submitted to the LMAX Exchange if Rule 14.3 (Rejection) applies or based on (A) the fact that (i) in the determination of the Applicant, the NDF order is likely to cause an excessively inverted market, (ii) the Member (whether by as a result of trading by the Member or by one of its DMA Clients) has breached the orders per second threshold which is agreed with the Applicant from time to time, (iii) the NDF order is greater than the clip size limit from time to time, or (iv) the NDF order will cause the Member to exceed any working order limit set for it by the Applicant from time to time in respect of the relevant LMAX contract; or (B) any other relevant information, that the NDF order is erroneous or invalid.
10.1 Financial Viability -- The exchange has sufficient financial resources for the proper performance of its functions and to meet its responsibilities.
10.1.1 The Applicant has adequate financial and staff resources to carry on its activities in full compliance with its regulatory requirements and with best practices. The Applicant is subject to minimum regulatory capital requirements, and must submit financial reports to the MAS.
10.1.2 To assess its regulatory capital requirements, the Applicant identifies risks that are relevant and material to its business as a whole. The Applicant assesses whether it is appropriate to hold capital against those risks either on a base case or under stressed scenarios.
10.1.3 The Applicant is capitalized in excess of regulatory requirements and will maintain any future minimum capital amounts needed to meet MAS's requirements.
11.1 Trading Practices -- Trading practices are fair, properly supervised and not contrary to the public interest.
11.1.1 The Applicant is obligated to comply with the Applicable Rules and requirements which require trading practices that are fair, properly supervised and not contrary to the public interest. Specifically, the Applicable Rules, which the Applicant adheres to, provides:
(a) Fair trading practices: Section 33(1)(e) of the SFA requires the Applicant to operate in a "fair, orderly and transparent manner".
(b) Properly supervised trading practices: Under Part XII, Division 1 of the SFA, the MAS has established a comprehensive regulatory framework to ensure market integrity and prevent insider dealing and market manipulation in relation to securities, units in collective investment schemes and derivatives contracts. This framework prohibits, and authorises MAS to take enforcement action against, practices which could result in distorting the functioning of the markets, including:
• false trading and market rigging (section 197 of the SFA);
• bucketing (section 201A of the SFA);
• price manipulation (section 201B of the SFA);
• employment of fraudulent or deceptive device (section 201 of the SFA); and
• dissemination of information about illegal transactions (section 202 of the SFA).
(c) Trading practices that are not contrary to the public interest: Pursuant to Notice CMG-N01 -- Reporting of Suspicious Activities and Incidents of Fraud, the Applicant will report to the MAS any suspicious activities and incidents of fraud where such activities or incidents are material to its safety, soundness or reputation. The MAS has the power to investigate and impose unlimited fines for market abuse, and to prosecute for market manipulation. A participant may be referred to a regulator in another jurisdiction with which the MAS has entered into a memorandum of understanding. Furthermore, section 33(1)(e) of the SFA requires the Applicant to operate in a "fair, orderly and transparent manner"
11.1.2 Rule 26 (Trade Formation) of the RMO Rulebook addresses permitted and prohibited practices on LMAX Exchange, incorporates the Applicable Rules requirements outlined above and is designed to ensure a fair, orderly and transparent market accessible to all eligible participants, which market is properly supervised and operated in a manner consistent with the public interest.
11.2 Orders -- Rules pertaining to order size and limits are fair and equitable to all market participants and the system for accepting and distinguishing between and executing different types of orders is fair, equitable and transparent.
11.2.1 Central Limit Orderbook. As the orderbook of the Applicant's trading system operates as CLOB, executing orders on a price-time priority, the model ensures that orders are consistently executed at the best available price in the orderbook, the execution is guaranteed insofar as there is liquidity in CLOB. The CLOB is an anonymous order-driven trading system, where transactions are concluded on the basis of firm orders that are continuously made available to participants, which requires market makers to maintain bid and offer orders for a CLOB in sizes that balance the needs of members and participants to deal in a commercial size and the risk to which the market makers expose themselves. For each OM Instrument, the best bid and offer by price of each market maker in that OM Instrument, together with the volumes attaching to those prices, will be public in the CLOB but on an anonymous basis without disclosing the identities of participants. The orders on the CLOB made public will be those that represent binding commitments to buy and sell the OM Instrument (through limit orders) and which indicate the price and volume of OM Instruments at which market makers are prepared to buy or sell. All participants have access to same modes of connectivity to LMAX Exchange (LMAX Exchange is available to participants via (i) the Financial Information eXchange application programming interface ("FIX") or ITCH protocols, (ii) proximity services, (iii) cross-connect or co-location directly in the Singapore data centre where LMAX Exchange's matching facility is located, and (iv) connectivity services provided by third party technological service providers).
11.2.2 Order types. LMAX Exchange supports the following order types: limit immediate-or-cancel, limit fill-or-kill, limit good-for-day, market immediate-or-cancel and market fill-or-kill. With regards to unfilled orders, in the case of immediate-or-cancel and fill-or-kill orders any unfilled quantity is immediately cancelled and in the case of good-for-day orders, any unfilled orders will rest on the orderbook until either of the following conditions occur: the order is cancelled by trading participant, the order is executed, the trading participant's FIX session is disconnected (at which point all unfilled orders are cancelled-on-disconnect), or the trading day ends (at which point all unfilled orders are cancelled). Request for quote, request for stream and request for market protocols will not be offered through LMAX Exchange.
11.2.3 Venue Controls. The Applicant operates the following venue controls on LMAX Exchange to ensure orders are executed fairly, equitably and transparently:
• Volatility bands -- Volatility bands are set per order book and are different for both price makers and takers. The bands reject a participant's order if, for price makers, the price on order is more than a defined percentage away from their last accepted price. For price takers, the order is compared against the top of book price. Where a volatility band is breached, new orders from that participant will be rejected and an internal approval process is triggered to assess whether the volatility bands must be widened to enable the participant to continue to trade.
• Inversion protection -- Further to volatility bands, market inversion limits are set per order book where there are two or more market makers. Where a market inverts beyond the set inversion parameter no orders can be matched. Where there are at least three maker participants and the market is inverted beyond the set threshold for more than 100 milliseconds, the maker responsible for the inversion will have their orders cancelled and further order entry blocked for 15 seconds. Where the market is inverted beyond the set thresholds, taker orders are rejected.
• Order throttling -- The Applicant operates real-time monitoring and alerting of the message rates and performance of all orders placed on its production systems on an individual session and aggregate basis. Order per second limits are set per FIX session, which applies for all instructions received over the FIX session. If the limit is breached, the FIX session is disconnected and re-connection is blocked for 15 seconds. The default setting is 750 updates per second but the limit can vary for maker participants according to number of instruments and depth priced.
• Order-to-trade ratios -- Order-to-trade ratio monitoring is conducted per participant per orderbook. Reports are run on a daily basis, over 15 minute windows, and any outliers investigated and raised with participants.
• Pre-trade controls -- Clip size limits set a maximum order size for each participant. Orders in excess of the clip size limit are rejected.
• Working order limits -- Working order limits restrict the total unfilled passive order volume that can be submitted per participant on each OM Instrument. Orders with volume that will breach the limit are rejected.
• Post trade controls -- Net open position limits are set per Member and per DMA Client as applicable. Email alerts are sent at 75%, 85% and 95% utilisation of a participant's limit. At 95% utilisation all trading is disabled for the participant. Typically clip size limits are set to 5% of the credit limit to avoid a breach of 100% of the participant's limit. Members and DMA Clients can set up alerts as their accounts approach pre-set margin utilisation levels.
• Kill switch -- Where a participant's NOP utilisation exceeds 95%, all existing working orders are cancelled and new orders are rejected. Where a participant breaches their set order update limit, they are disconnected and all their orders are cancelled. A participant's activity can be disabled at any point in time by removing their credit limit. When a participant's FIX session is disconnected for any reason all their working orders on that session will be immediately cancelled.
11.3 Transparency -- The exchange has adequate arrangements to record and publish accurate and timely information as required by applicable law or the Foreign Regulator. This information is also provided to all participants on an equitable basis.
11.3.1 Pre- and post-trade trading information is made publicly available through the use of the Applicant's pre and post-trade transparency widgets available at https://www.lmax.com/exchange/fx-ndfs, with no longer than a 5-minute delay.
11.3.2 Trade reporting obligations for derivatives transactions pursuant to Ontario law apply to a reporting counterparty to a derivatives transaction involving a local counterparty. For purposes of compliance with Ontario law, dealer counterparties that are determined to be reporting counterparties may satisfy the reporting requirements under Ontario law by reporting derivatives transactions to an entity that is designated as a trade repository.
12.1 Jurisdiction -- The exchange or the Foreign Regulator has the jurisdiction to perform member and market regulation, including the ability to set rules, conduct compliance reviews and perform surveillance and enforcement.
12.1.1 An OM is required under the Applicable Rules to set rules, conduct compliance reviews, monitor participants' trading activity and take enforcement action against participants when appropriate.
12.1.2 Pursuant to Notice CMG-N01 -- Reporting of Suspicious Activities and Incidents of Fraud, the Applicant will report to the MAS any suspicious activities and incidents of fraud where such activities or incidents are material to its safety, soundness or reputation. The MAS has the power to investigate and impose unlimited fines for market abuse, and to prosecute for market manipulation. A participant may be referred to a regulator in another jurisdiction with which the MAS has entered into a memorandum of understanding. The MAS may choose to take further action against a participant in its discretion.
12.1.3 The Applicant will comply with its regulatory obligations and supply data and information to the MAS when required, and will also assist the MAS in any investigation conducted regarding trading on LMAX Exchange. Please also see Section 5.
12.2 Member and Market Regulation -- The exchange or the Foreign Regulator maintains appropriate systems, resources and procedures for evaluating compliance with exchange and legislative requirements and for disciplining participants.
12.2.1 The Applicant has instituted procedures and controls to collect information, examine participants' records, supervise trading on LMAX Exchange, maintain sufficient compliance staff, establish procedures for and conduct audit trail reviews, perform automated real-time market monitoring and market surveillance and establish an automated trade surveillance system to evaluate participants' compliance with the RMO Rulebook and applicable law.
12.2.2 Sections 5 and 7 of this application describe the resources available to the Applicant to investigate breaches of the RMO Rulebook and to enforce its rules.
12.3 Availability of Information to Regulators -- The exchange has mechanisms in place to ensure that the information necessary to conduct adequate surveillance of the system for supervisory or enforcement purposes is available to the relevant regulatory authorities, including the Commission, on a timely basis.
12.3.1 Please see Section 16 below.
13.1 Record Keeping -- The exchange has and maintains adequate systems in place for the keeping of books and records, including, but not limited to, those concerning the operations of the exchange, audit trail information on all trades, and compliance with, and/or violations of exchange requirements.
13.1.1 The Applicable Rules require the Applicant to keep orderly records of its business and internal organization, including all services and transactions undertaken by it to enable the MAS to monitor it. The Applicant implemented policies designed to ensure that the MAS has ready access to the Applicant's records that it is required to maintain under Applicable Rules, from which the MAS should be able to reconstruct each key stage of a transaction on LMAX Exchange if required.
13.1.2 The Applicant complies with applicable regulatory record retention requirements. Under the Applicable Rules, the MAS requires the Applicant to keep records for a period of five years after the date of the expiry or termination of a contract, an agreement or a transaction to which the book or information relates.
13.1.3 Rule 7.2 (Transaction records) of the RMO Rulebook provides that Members must retain for at least five years, or such longer period as required by applicable laws, a record of each transaction arising from orders submitted by or on behalf of that Member or by or on behalf of a DMA Client in the member's name. DMA Clients must retain for at least five years, or such longer period as required by applicable laws, a record of each transaction arising from orders submitted on behalf of it in a Member's name.
13.1.4 The Applicant also keeps records of each grant and each denial or limitation of access, including reasons for granting, denying or limiting access, along with a record of any breaches of LMAX Exchange rules by its participants.
14.1 Outsourcing -- Where the exchange has outsourced any of its key services or systems to a service provider, it has appropriate and formal arrangements and processes in place that permit it to meet its obligations and that are in accordance with industry best practices.
14.1.1 Pursuant to a service agreement (the "Service Agreement"), the Applicant outsources the provision of ancillary technological and operational support functions to its affiliate, LMAX Limited, acting as the operator of LMAX Exchange and LMAX MTF. LMAX Limited complies with the UK FCA systems and controls requirement in relation to outsourcing, business and service continuity, and maintains strong business continuity and cyber-security frameworks.
14.1.2 LMAX Limited has outsourced its technological operational functions to other entities in the LMAX Group from the commencement of LMAX Group's business, including to various investment firms regulated by the UK FCA, the Cyprus Securities and Exchange Commission, the Gibraltar Financial Services Commission and another Singaporean entity who has recently received its capital markets services licence from the MAS for certain investments in financial instruments. See Section 9.2.6.
14.1.3 Under the Applicable Rules, the Applicant must ensure when outsourcing critical or important operational functions that (among other things), (i) it takes reasonable steps to avoid undue additional operational risk and (ii) the outsourcing does not materially impair the quality of its internal control and the ability of the MAS to monitor its compliance with regulatory obligations. The Applicant remains fully responsible for discharging its obligations under the regulatory system and must ensure that the outsourcing does not alter its relationship and obligations towards participants. The Applicant's procedures are designed to ensure that the relevant regulatory requirements are satisfied in connection with outsourcing of critical or important operational functions. All material outsourcing agreements require Board approval. The Service Agreement permits the Applicant to meet its obligations and is in conformance with industry best practices. The Applicant has the right to audit the services provided by LMAX Limited pursuant to the Service Agreement.
15.1 Fees
(a) All fees imposed by the exchange are reasonable and equitably allocated and do not have the effect of creating an unreasonable condition or limit on access by participants to the services offered by the exchange.
15.1.1 Section 33(1)(e) of the SFA requires the Applicant to operate LMAX Exchange in a "fair, orderly and transparent manner", including with respect to the Applicant's fee structure, any trading fees, ancillary fees and rebates. Pursuant to Regulation 25 of the Securities and Futures (Organised Markets) Regulations 2018, the Applicant must make available at no cost to any person upon that person's request, or publish in a manner that is accessible at no cost, information on the fees and charges applicable to each product available on LMAX Exchange and each service offered by the Applicant.
(b) The process for setting fees is fair and appropriate, and the fee model is transparent.
15.1.2 The Applicant ensures that its fee structure is sufficiently granular to allow LMAX Exchange participants to predict the payable fees on the basis of at least the following elements: (a) chargeable services, including the activity which will trigger the fee, (b) the fee for each service, stating whether the fee is fixed or variable, and (c) rebates, incentives or disincentives. The Applicant also publishes objective criteria for the establishment of its fees and fee structures, together with trading fees, ancillary fees, rebates, incentives and disincentives in one comprehensive rate card which is provided to participants upon request.
16.1 Information Sharing and Regulatory Cooperation -- The exchange has mechanisms in place to enable it to share information and otherwise cooperate with the Commission, self-regulatory organizations, other exchanges, clearing agencies, investor protection funds, and other appropriate regulatory bodies.
16.1.1 The Applicant has established a process that enables it to respond to requests from regulators regarding the Applicant in a timely manner. It is the Applicant's policy to respond promptly and completely to any proper regulatory inquiry or request for documents. All inquiries and other communications from the Commission will be referred immediately to the Applicant's Legal and Compliance department.
16.1.2 Rule 19.2 (Cooperation with the regulator) of the RMO Rulebook provides that subject to applicable laws, the Applicant may: (i) report to any governmental authority any material disruptions, any prohibited trade practices, any material breaches of the RMO Rulebook, disorderly trading conditions and conduct that may involve market abuse or breach or non-compliance with applicable laws; and (ii) assist any governmental authority in any investigation of market abuse, any prohibited trade practices or breach or non-compliance with appliable laws. The Applicant may disclose information and documents received from any participant in connection with its use of LMAX Exchange's services to any governmental authority where such information and documents are required in connection with an investigation, inquiry or proceedings by such authority. To the fullest extent permitted by applicable laws, the participant shall co-operate with the Applicant and any governmental authority in any investigation, proceeding or enquiry in relation to the Applicant and/or services of LMAX Exchange. Please see the discussion at Section 6.1.3(iv).
16.2 Oversight Arrangements -- Satisfactory information sharing and oversight agreements exist between the Ontario Securities Commission and the Foreign Regulator.
16.2.1 The OSC and the MAS are both signatories of (a) the Multilateral Memorandum of Understanding Concerning Consultation and Cooperation and the Exchange of Information of the International Organization of Securities Commissions dated May 2002, as revised in May 2012, which sets forth the signatory authorities' intent with regard to mutual assistance and the exchange of information for the purpose of enforcing and securing compliance, and (b) the Memorandum of Understanding Concerning Cooperation and the Exchange of Information Related to Supervision of Cross-Border Covered Entities dated July 15, 2021 between the OSC and the MAS{3}.
17.1 IOSCO Principles -- To the extent it is consistent with the laws of the foreign jurisdiction, the exchange adheres to the standards of the International Organization of Securities Commissions (IOSCO) including those set out in the "Principles for the Regulation and Supervision of Commodity Derivatives Markets" (2022).
17.1.1 The Applicant adheres to the standards of IOSCO to the extent that such standards are incorporated into the Applicable Rules. The MAS is a member of IOSCO and contributes to IOSCO's policy and standard setting work though participation in the various standing committees and task forces.
1.1 The OM Instruments that the Applicant intends to make available to trade on LMAX Exchange falls under the definition of "derivative" or "security" as set forth in subsection 1(1) of the Act. LMAX Exchange falls under the definition of "marketplace" set out in subsection 1(1) of the Act because it brings together buyers and sellers of securities and derivatives and uses established, non-discretionary methods under which orders interact with each other.
1.2 An "exchange" is not defined under the Act; however, subsection 3.1(1) of the companion policy to NI 21-101 provides that a "marketplace" is considered to be an "exchange" if it, among other things, sets requirements governing the conduct of marketplace participants. An OM has certain obligations to monitor participants' trading activity. Because an OM sets requirements for the conduct of its participants, it is considered by the Commission to be an exchange for purposes of the Act.
1.3 Pursuant to OSC Staff Notice 21-702 -- Regulatory Approach for Foreign-Based Stock Exchanges, the Commission considers an exchange located outside Ontario to be carrying on business as an exchange in Ontario if it provides Ontario Participants with direct access to the exchange. The Applicant acknowledges that providing Ontario Participants with direct access to trading of the OM Instruments on LMAX Exchange is considered by the Commission to be "carrying on business as an exchange" in Ontario, and therefore must either be recognised or exempt from recognition by the Commission.
1.4 The Applicant notes that exemptive relief in respect of trading NDFs has been granted to the following foreign applicant: In the Matter of Brokertec Europe Limited (December 1, 2022). Exemptive relief in respect of an OM operated by applicant recognised by MAS as an RMO has been granted to the following foreign applicant: In the Matter of Bloomberg Tradebook Singapore Pte Ltd. (July 27, 2022).
1.5 The Applicant satisfies all the criteria for exemption from recognition as an exchange set forth by Commission Staff, as described under PART III of this application, for the OM Instruments. Ontario Participants that trade in the OM Instruments would benefit from the ability to trade on LMAX Exchange, as they would have access to trading NDFs with counterparties that otherwise may not be available in Ontario. Stringent MAS oversight of LMAX Exchange, as well as the sophisticated information systems, regulations and compliance functions that have been adopted by the Applicant are designed to ensure that Ontario Participants are adequately protected in accordance with international standards set by IOSCO.
1.6 The Applicant submits that an exemption from recognition is appropriate for LMAX Exchange because the Applicant is subject to regulation by the MAS and full regulation by the Commission would be duplicative and inefficient. The consequence of the Requested Relief not being granted would be loss of access to LMAX Exchange for the Ontario Participants which would reduce their access to liquidity and therefore Ontario capital markets will be disrupted if the Requested Relief is not granted.
1.7 Based on the foregoing, we submit that it would not be prejudicial to the public interest to grant the Requested Relief.
We have attached a certificate of verification signed by the Applicant as Appendix "A "and a draft of the Exemption Order for your consideration as Appendix "B".
Payment of the filing fee of C$20,000 has been provided.
If you have any questions concerning this application, please do not hesitate to contact Tim Phillips at Tim.Phillips@blakes.com.
Yours very truly,
Citation:
, 2024
WHEREAS LMAX Pte. Ltd. (Applicant) has filed an application dated April 18, 2024 (Application) with the Ontario Securities Commission (Commission) requesting an order for the following relief (collectively, the Requested Relief):
(a) exempting the Applicant from the requirement to be recognized as an exchange under subsection 21(1) of the Act pursuant to section 147 of the Act; and
(b) exempting the Applicant from the requirements in National Instrument 21-101 Marketplace Operation (NI 21-101) pursuant to section 15.1 of NI 21-101, the requirements of National Instrument 23-101 Trading Rules (NI 23-101) pursuant to section 12.1 of NI 23-101 and the requirements of National Instrument 23-103 Electronic Trading and Direct Electronic Access to Marketplaces (NI 23-103) pursuant to section 10 of NI 23-103;
AND WHEREAS the Applicant has represented to the Commission that:
1. The Applicant is a private limited company incorporated under the laws of the Republic of Singapore and a wholly owned direct subsidiary of LMAX Exchange Group Limited, a private limited company incorporated under the laws of the Bailiwick of Jersey;
2. The Applicant has obtained recognition as a recognised market operator (RMO) from the Monetary Authority of Singapore (MAS);
3. The Applicant's current recognition as an RMO from the MAS, dated November 17, 2023, permits the Applicant to: (a) operate an organised market (OM) in respect of over-the-counter derivatives contracts (e.g., credit default swaps, interest rate swaps, foreign exchange derivatives, and commodity derivatives); and (b) in respect of participants in Singapore, make available its OM to Professional Investors, Accredited Investors and Expert Investors, as such terms are defined within the Applicant's RMO Recognition Letter and the Singapore Securities and Futures Act 2001 (SFA);
4. The Applicant is the operator of an OM, operated under the trading name LMAX Exchange, that is regulated and authorised by the MAS to allow trading of foreign exchange non-deliverable forward contracts (FX NDFs or the Ontario Market Instruments);
5. The subject of this order is the trading system operated by LMAX Exchange that facilitates the placing and matching of transactions in Ontario Market Instruments;
6. The Applicant is subject to regulatory supervision by the MAS and is required to comply with applicable Singapore laws, subsidiary legislation, notices and guidelines issued by the MAS (collectively, the Applicable Rules), which include, among other things, rules on (i) the conduct of business (including rules regarding client categorization, communication with clients and other investor protections and client agreements), (ii) market conduct (including rules applicable to firms operating an OM), and (iii) systems and controls (including rules on outsourcing, governance, record-keeping and conflicts of interest). The MAS requires the Applicant to comply at all times with a set of threshold conditions for authorization and ongoing requirements, including requirements that the Applicant has sound business and controlled business operations and that it has appropriate resources for the activities it carries on. The Applicant is required to maintain a permanent and effective compliance function, which is headed by the Applicant's Compliance Officer. The Applicant's Compliance Department is responsible for implementing and maintaining adequate policies and procedures designed to ensure that the Applicant, its officers and all its employees comply with their obligations under the Applicable Rules;
7. An OM is obliged under MAS rules to have requirements governing the conduct of participants, to monitor compliance with those requirements and report to the MAS (i) significant breaches of the rules in the LMAX Exchange RMO Rulebook (RMO Rulebook), (ii) disorderly trading conditions, and (iii) conduct that may involve market abuse. As required by the Applicable Rules, the Applicant has implemented a trade surveillance program. As part of the program and as required by the MAS, the Applicant's Compliance and Market Operations teams conduct market monitoring of trading activity on LMAX Exchange to identify disorderly trading and market abuse or anomalies. The trade surveillance program is designed to maintain a fair and orderly market for LMAX Exchange's participants;
8. The Applicant is not involved in, nor is it responsible for, settlement or clearing of FX NDFs and the counterparties to such trades make their own bilateral arrangements;
9. The Applicant requires that each of its participants incorporated or established in Singapore be an "institutional investor," "professional investor," "accredited investor" or "expert investor" as defined in the SFA. Each prospective participant must be of sufficient good repute; have sufficient levels of trading ability, competence and experience; and have adequate governance and organisational arrangements to oversee their trading;
10. All participants located in Ontario, including participants with their headquarters or legal address in Ontario (e.g., as indicated by a participant's Legal Entity Identifier (LEI)) and all traders conducting transactions on its behalf, regardless of the traders' physical location (inclusive of non-Ontario branches of Ontario legal entities), as well as any trader physically located in Ontario who conducts transactions on behalf of any other entity (Ontario Participants) are required to be registered under Ontario securities laws, exempt from registration or not subject to registration requirements. An Ontario Participant is required to immediately notify the Applicant if it ceases to meet any of the above criteria represented by it on an ongoing basis. An Ontario Participant may be a bank member of LMAX Exchange or a direct market access client of a bank member;
11. The Applicant does not offer access to retail clients;
12. Because LMAX Exchange sets requirements for the conduct of its participants and surveils certain trading activity of its participants, it is considered by the Commission to be an exchange;
13. Because the Applicant seeks to provide Ontario Participants with direct access to trading the Ontario Market Instruments on LMAX Exchange in accordance with the Requested Relief, it is considered by the Commission to be carrying on business as an exchange in Ontario and is required to be recognized as such or exempted from recognition pursuant to section 21 of the Act;
14. The Applicant has no physical presence in Ontario and does not otherwise carry on business in Ontario except as described herein; and
15. The Applicant satisfies the exemption criteria as described in Appendix "I" to Schedule "A";
AND WHEREAS the products traded on LMAX Exchange are not commodity futures contracts as defined in the Commodity Futures Act (Ontario) and the Applicant is not considered to be carrying on business as a commodity futures exchange in Ontario;
AND WHEREAS the Commission will monitor developments in international and domestic capital markets and the Applicant's activities on an ongoing basis to determine whether it is appropriate for the Requested Relief to continue to be granted subject to the terms and conditions set out in Schedule "A" to this order;
AND WHEREAS the Applicant has acknowledged to the Commission that the scope of the Requested Relief and the terms and conditions imposed by the Commission set out in Schedule "A" to this order may change as a result of the Commission's monitoring of developments in international and domestic capital markets or the Applicant's activities, or as a result of any changes to the laws in Ontario affecting trading in derivatives or securities;
AND WHEREAS based on the Application, together with the representations made by and acknowledgments of the Applicant to the Commission, the Commission has determined that the Applicant satisfies the criteria set out in Appendix "I" to Schedule "A" and that the granting of the Requested Relief would not be prejudicial to the public interest;
IT IS HEREBY ORDERED by the Commission that (i) pursuant to section 147 of the Act, the Applicant is exempt from recognition as an exchange under subsection 21(1) of the Act, and (ii) pursuant to sections 15.1 of NI 21-101, 12.1 of NI 23-101 and 10 of NI 23-103, the Applicant is exempt from the requirements in NI 21-101, NI 23-101 and NI 23-103,
PROVIDED THAT the Applicant complies with the terms and conditions contained in Schedule "A".
DATED •, 2024
"•" |
|
________________________________________ |
________________________________________ |
• |
|
Ontario Securities Commission |
1. The Applicant will continue to meet the criteria for exemption included in Appendix "I" to this Schedule.
2. The Applicant will maintain its recognition as a Recognised Market Operator (RMO) with the Monetary Authority of Singapore (MAS) to operate an organised market (OM) and will continue to be subject to the regulatory oversight of the MAS.
3. The Applicant will continue to comply with the ongoing requirements applicable to it as an RMO recognised by the MAS.
4. The Applicant will promptly notify the Commission if its recognition as an RMO has been revoked, suspended, or amended by the MAS, or the basis on which its recognition as an RMO has been granted has significantly changed.
5. The Applicant must do everything within its control, which includes cooperating with the Commission as needed, to carry out its activities as an exchange exempted from recognition under subsection 21(1) of the Act in compliance with Ontario securities law.
6. The Applicant will not provide direct access to a participant in Ontario including a participant with its headquarters or legal address in Ontario (e.g., as indicated by a participant's Legal Entity Identifier (LEI)) and all traders conducting transactions on its behalf, regardless of the traders' physical location (inclusive of non-Ontario branches of Ontario legal entities), as well as any trader physically located in Ontario who conducts transactions on behalf of any other entity (Ontario Participant) unless the Ontario Participant is appropriately registered as applicable under Ontario securities laws or is exempt from or not subject to those requirements.
7. For each Ontario Participant provided direct access to the Applicant's OM (whether as a bank member or as a direct market access client), the Applicant will require, as part of its application documentation or continued access to the OM, the Ontario Participant to represent that it is appropriately registered as applicable under Ontario securities laws or is exempt from or not subject to those requirements.
8. The Applicant may reasonably rely on a written representation from the Ontario Participant that specifies either that it is appropriately registered as applicable under Ontario securities laws or is exempt from or not subject to those requirements, provided the Applicant notifies such Ontario Participant that this representation is deemed to be repeated each time it enters an order, request for quote or response to a request for quote or otherwise uses the Applicant's OM.
9. The Applicant will require Ontario Participants to notify the Applicant if their registration as applicable under Ontario securities laws has been revoked, suspended, or amended by the Commission or if they are no longer exempt from or become subject to those requirements and, following notice from the Ontario Participant and subject to applicable laws, the Applicant will promptly restrict the Ontario Participant's access to the Applicant's OM if the Ontario Participant is no longer appropriately registered or exempt from those requirements.
10. The Applicant will not provide access to an Ontario Participant to trading in products other than the Ontario Market Instruments set out in Representation 5, without prior Commission approval.
11. If the Applicant provides Ontario Participants access to cleared instruments, the Applicant must submit, or cause to be submitted, all trades that are required to be cleared to a clearing agency or clearing house that is regulated as a clearing agency or clearing house by the applicable regulator.
12. With respect to a proceeding brought by the Commission arising out of, related to, concerning or in any other manner connected with the Commission's regulation and oversight of the activities of the Applicant in Ontario, the Applicant will submit to the non-exclusive jurisdiction of (i) the courts and administrative tribunals of Ontario and (ii) an administrative proceeding in Ontario.
13. The Applicant will maintain with the Commission a valid and binding appointment of an agent for service in Ontario upon whom the Commission may serve a notice, pleading, subpoena, summons or other process in any action, investigation or administrative, criminal, quasi-criminal, penal or other proceeding arising out of, related to, concerning or in any other manner connected with the Commission's regulation and oversight of the Applicant's activities in Ontario.
14. The Applicant will notify staff of the Commission promptly of:
(a) any authorization to carry on business granted by the MAS is revoked or suspended or made subject to terms or conditions on the Applicant's operations;
(b) the Applicant institutes a petition for a judgment of bankruptcy or insolvency or similar relief, or to wind up or liquidate the Applicant or has a proceeding for any such petition instituted against it;
(c) a receiver is appointed for the Applicant or the Applicant makes any voluntary arrangement with creditors;
(d) the Applicant marketplace is not in compliance with this Order or with any applicable requirements, laws or regulations of the MAS where it is required to report such non-compliance to the MAS;
(e) any known investigations of, or disciplinary action against, the Applicant by the MAS or any other regulatory authority to which it is subject; and
(f) the Applicant makes any material change to the eligibility criteria for Ontario Participants.
15. The Applicant will maintain the following updated information and submit such information in a manner and form acceptable to the Commission on a semi-annual basis (by July 31 for the first half of the calendar year and by January 31 of the following year for the second half), and at any time promptly upon the request of staff of the Commission:
(a) a current list of all Ontario Participants and whether the Ontario Participant is registered under Ontario securities laws or is exempt from or not subject to registration, and, to the extent known by the Applicant, other persons or companies located in Ontario trading on the Applicant's OM as customers of participants (Other Ontario Participants);
(b) the legal entity identifier assigned to each Ontario Participant, and, to the extent known by the Applicant, to Other Ontario Participants in accordance with the standards set by the Global Legal Entity Identifier System;
(c) a list of all Ontario Participants whom the Applicant has referred to the MAS, or, to the best of the Applicant's knowledge, whom have been disciplined by the MAS with respect to such Ontario Participants' activities on the Applicant's OM and the aggregate number of all participants referred to the MAS since the previous report by the Applicant;
(d) a list of all active investigations since the last report by the Applicant relating to Ontario Participants and the aggregate number of active investigations since the last report relating to all participants undertaken by the Applicant;
(e) a list of all Ontario applicants for status as a participant who were denied such status or access to the Applicant since the last report, together with the reasons for each such denial;
(f) for each product,
(i) the total trading volume and value originating from Ontario Participants, and, to the extent known by the Applicant, from Other Ontario Participants, presented on a per Ontario Participant or per Other Ontario Participant basis; and
(ii) the proportion of worldwide trading volume and value on the Applicant's OM conducted by Ontario Participants, and, to the extent known by the Applicant, by Other Ontario Participants, presented in the aggregate for such Ontario Participants and Other Ontario Participants;
provided in the required format.
16. The Applicant will provide such information as may be requested from time to time by, and otherwise cooperate with, the Commission or its staff, subject to any applicable privacy or other laws (including solicitor-client privilege) governing the sharing of information and the protection of personal information.
The exchange is regulated in an appropriate manner in another jurisdiction by a foreign regulator (Foreign Regulator).
The Foreign Regulator has the appropriate authority and procedures for oversight of the exchange. This includes regular, periodic oversight reviews of the exchange by the Foreign Regulator.
The governance structure and governance arrangements of the exchange ensure:
(a) effective oversight of the exchange,
(b) that business and regulatory decisions are in keeping with its public interest mandate,
(c) fair, meaningful and diverse representation on the board of directors (Board) and any committees of the Board, including:
(i) appropriate representation of independent directors, and
(ii) a proper balance among the interests of the different persons or companies using the services and facilities of the exchange,
(d) the exchange has policies and procedures to appropriately identify and manage conflicts of interest for all officers, directors and employees, and
(e) there are appropriate qualifications, remuneration, limitation of liability and indemnity provisions for directors, officers and employees of the exchange.
The exchange has policies and procedures under which it will take reasonable steps, and has taken such reasonable steps, to ensure that each director and officer is a fit and proper person and past conduct of each officer or director affords reasonable grounds for belief that the officer or director will perform his or her duties with integrity.
The products traded on the exchange and any changes thereto are submitted to the Foreign Regulator, and are either approved by the Foreign Regulator or are subject to requirements established by the Foreign Regulator that must be met before implementation of a product or changes to a product.
The terms and conditions of trading the products are in conformity with the usual commercial customs and practices for the trading of such products.
The exchange maintains adequate provisions to measure, manage and mitigate the risks associated with trading products on the exchange that may include, but are not limited to, daily trading limits, price limits, position limits, and internal controls.
(a) The exchange has established appropriate written standards for access to its services including requirements to ensure
(i) participants are appropriately registered as applicable under Ontario securities laws, or exempted from these requirements,
(ii) the competence, integrity and authority of systems users, and
(iii) systems users are adequately supervised.
(b) The access standards and the process for obtaining, limiting and denying access are fair, transparent and applied reasonably.
(c) The exchange does not unreasonably prohibit, condition or limit access by a person or company to services offered by it.
(d) The exchange does not
(i) permit unreasonable discrimination among participants, or
(ii) impose any burden on competition that is not reasonably necessary and appropriate.
(e) The exchange keeps records of each grant and each denial or limitation of access, including reasons for granting, denying or limiting access.
The exchange has the authority, resources, capabilities, systems and processes to allow it to perform its regulation functions, whether directly or indirectly through a regulation services provider, including setting requirements governing the conduct of its participants, monitoring their conduct, and appropriately disciplining them for violations of exchange requirements.
(a) The exchange has rules, policies and other similar instruments (Rules) that are designed to appropriately govern the operations and activities of participants and do not permit unreasonable discrimination among participants or impose any burden on competition that is not reasonably necessary or appropriate.
(b) The Rules are not contrary to the public interest and are designed to
(i) ensure compliance with applicable legislation,
(ii) prevent fraudulent and manipulative acts and practices,
(iii) promote just and equitable principles of trade,
(iv) foster co-operation and co-ordination with persons or companies engaged in regulating, clearing, settling, processing information with respect to, and facilitating transactions in the products traded on the exchange,
(v) provide a framework for disciplinary and enforcement actions, and
(vi) ensure a fair and orderly market.
For any decision made by the exchange that affects a participant, or an applicant to be a participant, including a decision in relation to access, exemptions, or discipline, the exchange ensures that:
(a) parties are given an opportunity to be heard or make representations, and
(b) it keeps a record of, gives reasons for, and provides for appeals or reviews of its decisions.
The exchange has or requires its participants to have appropriate arrangements for the clearing and settlement of transactions for which clearing is mandatory through a clearing house.
The exchange has assured itself that the clearing house has established appropriate risk management policies and procedures, contingency plans, default procedures and internal controls.
Each of the exchange's critical systems has appropriate internal controls to ensure completeness, accuracy, integrity and security of information, and, in addition, has sufficient capacity and business continuity plans to enable the exchange to properly carry on its business. Critical systems are those that support the following functions:
(a) order entry,
(b) order routing,
(c) execution,
(d) trade reporting,
(e) trade comparison,
(f) data feeds,
(g) market surveillance,
(h) trade clearing, and
(i) financial reporting.
Without limiting the generality of section 9.1, for each of its systems supporting order entry, order routing, execution, data feeds, trade reporting and trade comparison, the exchange:
(a) makes reasonable current and future capacity estimates;
(b) conducts capacity stress tests to determine the ability of those systems to process transactions in an accurate, timely and efficient manner;
(c) reviews the vulnerability of those systems and data centre computer operations to internal and external threats, including physical hazards and natural disasters;
(d) ensures that safeguards that protect a system against unauthorized access, internal failures, human errors, attacks and natural catastrophes that might cause improper disclosures, modification, destruction or denial of service are subject to an independent and ongoing audit which should include the physical environment, system capacity, operating system testing, documentation, internal controls and contingency plans;
(e) ensures that the configuration of the system has been reviewed to identify potential points of failure, lack of back-up and redundant capabilities;
(f) maintains reasonable procedures to review and keep current the development and testing methodology of those systems; and
(g) maintains reasonable back-up, contingency and business continuity plans, disaster recovery plans and internal controls.
The exchange has appropriate risk management procedures in place including those that handle trading errors, trading halts and respond to market disruptions and disorderly trading.
The exchange has sufficient financial resources for the proper performance of its functions and to meet its responsibilities.
Trading practices are fair, properly supervised and not contrary to the public interest.
Rules pertaining to order size and limits are fair and equitable to all market participants and the system for accepting and distinguishing between and executing different types of orders is fair, equitable and transparent.
The exchange has adequate arrangements to record and publish accurate and timely information as required by applicable law or the Foreign Regulator. This information is also provided to all participants on an equitable basis.
The exchange or the Foreign Regulator has the jurisdiction to perform member and market regulation, including the ability to set rules, conduct compliance reviews and perform surveillance and enforcement.
The exchange or the Foreign Regulator maintains appropriate systems, resources and procedures for evaluating compliance with exchange and legislative requirements and for disciplining participants.
The exchange has mechanisms in place to ensure that the information necessary to conduct adequate surveillance of the system for supervisory or enforcement purposes is available to the relevant regulatory authorities, including the Commission, on a timely basis.
The exchange has and maintains adequate systems in place for the keeping of books and records, including, but not limited to, those concerning the operations of the exchange, audit trail information on all trades, and compliance with, and/or violations of exchange requirements.
Where the exchange has outsourced any of its key services or systems to a service provider, it has appropriate and formal arrangements and processes in place that permit it to meet its obligations and that are in accordance with industry best practices.
(a) All fees imposed by the exchange are reasonable and equitably allocated and do not have the effect of creating an unreasonable condition or limit on access by participants to the services offered by the exchange.
(b) The process for setting fees is fair and appropriate, and the fee model is transparent.
The exchange has mechanisms in place to enable it to share information and otherwise co-operate with the Commission, self-regulatory organizations, other exchanges, clearing agencies, investor protection funds, and other appropriate regulatory bodies.
Satisfactory information sharing and oversight agreements exist between the Commission and the Foreign Regulator.
To the extent it is consistent with the laws of the foreign jurisdiction, the exchange adheres to the standards of the International Organization of Securities Commissions (IOSCO) including those set out in the "Principles for the Regulation and Supervision of Commodity Derivatives Markets" (2022).
{1} The Rulebook currently has an effective date of November 2023 and is available here: https://www.lmax.com/documents/LMAXExchange-RMO-Rulebook.pdf.
{2} The Fit and Proper Guidelines can be found at https://www.mas.gov.sg/regulation/guidelines/guidelines-on-fit-and-proper-criteria.
{3} Available at https://www.osc.ca/en/about-us/domestic-and-international-engagement/international-mous/notice-memorandum-understanding-cooperation-and-exchange-information-related-0.
CDS Clearing and Depository Services Inc. (CDS) -- Proposed Amendments to CDS Procedures and CDS Fee Schedule Related to the Cessation of the Euroclear France Link and SEB Link Services -- Notice of Commission Approval
In accordance with the Rule Protocol between the Ontario Securities Commission (Commission) and CDS Clearing and Depository Services Inc., the Commission approved on April 22, 2024, the proposed amendments to the CDS procedures and CDS fee schedule with respect to the cessation of the Euroclear France Link and SEB Link services.
For further details, please see the Request for Comments Notice published on the CDS website on January 19, 2024.