Ontario Securities Commission Bulletin
Issue 45/46 - November 17, 2022
Ont. Sec. Bull. Issue 45/46
• Temporary, Permanent & Rescinding Issuer Cease Trading Orders
• Temporary, Permanent & Rescinding Management Cease Trading Orders
- - - - - - - - - - - - - - - - - - - - - - - - - - - - - - - - - - - - - - - - - - - - - - - - - -
Cormark Securities Inc. et al. -- ss. 127, 127.1
FILE NO.: 2022-24
PROCEEDING TYPE: Enforcement Proceeding
HEARING DATE AND TIME: November 23, 2022 at 10:00 a.m.
LOCATION: By videoconference
The purpose of this proceeding is to consider whether it is in the public interest for the Capital Markets Tribunal to make the orders requested in the Statement of Allegations filed by Staff of the Commission on the 9th day of November, 2022.
The hearing set for the date and time indicated above is the first attendance in this proceeding, as described in subsection 5(1) of the Capital Markets Tribunal Practice Guideline.
Any party to the proceeding may be represented by a representative at the hearing.
IF A PARTY DOES NOT ATTEND, THE HEARING MAY PROCEED IN THE PARTY'S ABSENCE AND THE PARTY WILL NOT BE ENTITLED TO ANY FURTHER NOTICE IN THE PROCEEDING.
This Notice of Hearing is also available in French on request of a party. Participation may be in either French or English. Participants must notify the Tribunal in writing as soon as possible if the participant is requesting a proceeding be conducted wholly or partly in French.
L'avis d'audience est disponible en français sur demande d'une partie, que la participation à l'audience peut se faire en français ou en anglais et que les participants doivent aviser le Tribunal par écrit dès que possible si le participant demande qu'une instance soit tenue entièrement ou partiellement en français.
Dated at Toronto this 9th day of November, 2022.
For more information
Please visit capitalmarketstribunal.ca or contact the Registrar at registrar@osc.gov.on.ca.
1. This case is being brought to hold three sophisticated market participants accountable for an illegal and abusive short selling scheme that violated Ontario securities law and was contrary to the public interest.
2. The market participants were: (a) Cormark Securities Inc. (Cormark), a registered investment dealer; (b) William Jeffrey Kennedy (commonly known as Jeff Kennedy), Cormark's Head of Equity Capital Markets; and (c) their client Marc Bistricer, a registrant who used a private holding company, Saline Investments Ltd. (Saline), to engage in the transactions.
3. In the transactions, Saline, in anticipation of a private placement by Canopy Growth Corporation (Canopy):
(a) sold short shares of Canopy in the open market;
(b) bought an equal number of Canopy shares in the private placement;
(c) swapped the private placement shares for free-trading Canopy shares under a securities lending agreement; and
(d) used the free-trading shares to settle the short sales.
4. Saline put up no money of its own. It simply sold Canopy shares it did not own and used the proceeds to pay for the private placement shares, the securities loan and Cormark's services. Saline's profit was over $1.27 million.
5. The series of transactions resulted in an illegal distribution of Canopy shares in the secondary market. In addition, Cormark and Kennedy concealed the illegal short selling from their client, Canopy. They failed to deal fairly, honestly and in good faith with Canopy.
6. Besides violating Ontario securities law, the respondents acted contrary to the public interest. For example, if investment dealers like Cormark and Kennedy do not conduct themselves honestly and responsibly, issuers will not be able to trust and rely on them, and they will not be able to perform their crucial role of advancing securities offerings. In addition, this type of abusive short selling may cause unwarranted price declines around the times of offerings that reduce issuers' offering proceeds, inhibit capital formation and diminish confidence in the capital markets. Instead of fulfilling their responsibilities, as registrants, to uphold the integrity of the capital markets, Cormark, Kennedy and Bistricer benefitted themselves at the expense of those markets.
The following allegations of fact are made:
Short selling scheme
7. Cormark, Kennedy and their client Bistricer created and carried out an illegal and abusive short selling scheme.
8. They were sophisticated market participants. Cormark was a registered investment dealer. Kennedy was a director and officer of Cormark and its Managing Director of Equity Capital Markets and Operations. Bistricer was the Chief Executive Officer of a portfolio manager.
9. The three devised the series of transactions to profit from an anticipated spike in demand for Canopy shares resulting from Canopy joining the S&P/TSX Composite Index. Demand was expected to increase as index funds would want to buy Canopy shares to track the index.
10. After considering various ways to capitalize on the expected heightened demand, the three decided on a series of transactions involving a private placement, a securities loan and short sales. To engage in the transactions, Bistricer used Saline, a private holding company of which he was the sole director and officer. Saline effected the transactions on March 17, 2017, and settled them on March 22, 2017.
11. On March 17, the day Canopy joined the index, Saline entered a private placement subscription agreement with Canopy and a securities lending agreement with Goldman Holdings Ltd. (GHL), a private company that Murray Goldman, a Canopy director, used to hold his shares. In anticipation of these transactions, Saline sold short 2.5 million Canopy shares in the open market for approximately $26.76 million.
12. Three trading days later, on March 22, Saline was required to deliver free-trading shares to settle the short sales. To enable it to do so, the respondents arranged for the private placement and securities loan to close that day.
(a) In the private placement, Saline bought 2.5 million Canopy shares for $24.25 million. Canopy sold these shares to Saline under the accredited investor exemption from the prospectus requirement. As a result, the hold periods of Ontario securities law applied to them.
(b) In the securities loan, Saline swapped these restricted, private placement shares for free-trading Canopy shares. Saline provided the private placement shares to GHL as "collateral" (which GHL kept at the end of the loan). In exchange, Saline received 2.5 million free-trading Canopy shares from GHL and paid an $875,000 securities lending fee to GHL.
Finally, Saline used the borrowed, free-trading shares to settle the short sales.
13. Saline put up no money of its own. It used the short sale proceeds to pay for the private placement, the securities loan, and Cormark's services, which cost $362,500. Saline's profit was over $1.27 million.
14. Saline's and Cormark's profits were virtually risk-free. Saline entered into each transaction in contemplation of the others. It sold short when it fully expected to be able to settle the short sales with lower-cost shares acquired through the series of transactions. It was highly likely that the short sale orders would be filled because of the anticipated index fund demand. Last, Saline sold short most of the shares at the closing price. Saline could be confident in a 9% gain, because the private placement price had been previously set at a 9% discount to the closing price.
Illegal distribution
15. The series of transactions resulted in an illegal distribution of Canopy shares to the public, through the short sales. The short sales were part of a series of transactions involving a purchase and sale or a repurchase and resale in the course of or incidental to a distribution. That distribution was the private placement: a trade in securities that had not been previously issued.
16. The series of transactions ultimately resulted in the public, including retail investors, purchasing the Canopy shares that were sold short by Saline. The cash the public paid for those shares flowed through Saline to Canopy, as Canopy's offering proceeds. This was a public offering of Canopy shares. This type of illegal distribution is sometimes called a "backdoor underwriting".
17. Saline was an underwriter. As principal, it agreed to purchase shares in the private placement and securities loan with a view to distributing them through the short sales. Bistricer furthered those trades. Among other things, he structured the series of transactions, signed the private placement subscription agreement and securities lending agreement, and placed the short sale orders.
18. Cormark and Kennedy also furthered the distribution. Their acts in furtherance included formulating the series of transactions, approaching Canopy about the private placement and securities loan and coordinating those transactions. In addition, Cormark received the short sale orders and facilitated, on behalf of Saline, the execution of the orders through exchanges such as the Toronto Stock Exchange.
19. The distribution was illegal. No preliminary prospectus or prospectus was filed and exemptions from the prospectus requirement did not apply.
Failure to deal fairly, honestly and in good faith
20. In arranging the private placement and securities loan, Cormark and Kennedy failed to deal fairly, honestly and in good faith with their client, Canopy. As a result, Canopy could not make an informed decision about whether or not to become involved in the transactions.
21. Cormark and Kennedy presented the private placement and securities loan to Canopy as ordinary-course transactions in connection with Canopy's addition to the index, which addition would result in new, index fund demand for Canopy's shares and an opportunity for Canopy to raise capital. According to Cormark and Kennedy: the index funds were the ultimate buyers of the private placement; Saline was facilitating their purchases by acting as an intermediate buyer in the private placement; and Saline needed the securities loan so it could deliver to the index funds free-trading shares.
22. Their description was false. Saline needed the securities loan so it could settle the short sales. Cormark and Saline made those short sales in the open market where anyone-not just index funds-could buy the shares. In fact, the purchasers included retail investors who required a prospectus.
23. Cormark and Kennedy also hid from Canopy the benefits of the transactions to Saline. They concealed the short selling that facilitated Saline's virtually risk-free profits. They also understated the size of those profits. In discussing the securities loan with Canopy, they misrepresented the relationship between the 9% discount and the lending fee. They said that 6.5% annualized could be paid to Goldman, leaving "enough room" for a "small" discount for Saline and 1% to 1.5% commissions for Cormark. In fact, most of the profits were for Saline.
24. Cormark and Kennedy also made misleading statements about Canopy's cost of capital-and, by implication, its net proceeds. They advised Canopy that the costs of this deal compared favourably with those of Canopy's last deal. Their comparison omitted key information.
25. It was key that, in this deal, unlike the last, the underwriter (Saline) sold short the entire amount of the offering on the day of pricing. Those short sales may have curbed increases in, or reduced, the closing price, affecting the offering price and lowering Canopy's net proceeds. Because Cormark and Kennedy concealed the short selling, Canopy could not assess, or even identify, this risk to itself and its shareholders.
26. Cormark and Kennedy's dealings with Canopy were contrary to the public interest. They misrepresented the substance of the private placement and securities loan. These were not ordinary, low-cost transactions to satisfy new, index fund demand for Canopy's shares. Instead, these were crucial steps in an illegal and abusive short selling scheme that was devised to secure virtually risk-free profits for Saline and Cormark.
27. Investment dealers and their representatives are crucial for capital formation. If they are to effectively advance securities offerings, issuers must be able to trust them and rely on them. Dishonesty like Cormark and Kennedy's erodes the required trust. It risks the fairness, efficiency and competitiveness of Ontario's capital markets and confidence in them, contrary to a fundamental purpose of the Securities Act (the Act).
Further conduct contrary to the public interest
28. The respondents' conduct was abusive and contrary to the animating principles of Ontario securities law. It:
(a) undercut the timely, accurate and efficient disclosure of information;
(b) undermined the investor protection provided by hold periods;
(c) threatened the efficiency of, and confidence in, Ontario's capital markets; and
(d) failed to meet the high standards of fitness and business conduct applicable to registrants.
Avoiding disclosure
29. The respondents sought to minimize the timely, accurate and efficient disclosure of information.
30. First, they sized the private placement to be less than 2% of Canopy's outstanding shares so that, in their view, it was not material. As a result, neither the insider trading prohibition nor, as Cormark and Kennedy emphasized to Canopy, the material change reporting requirement, applied.
31. Nonetheless, Canopy decided to issue a news release on closing. Cormark and Kennedy prepared the first draft. It did not disclose the substance of the transactions, refer to the short selling or even name the broker, Cormark.
32. The non-disclosure reduced the risk of regulatory action. Because the entirety of the series of transactions was hidden, scrutiny by market participants and timely regulatory oversight was impossible.
33. The non-disclosure also reduced the risk of civil litigation. For example, the retail investors who purchased the short sold shares from Saline were entitled to a prospectus. Because they did not receive one, at common law, they had a right to recover the purchase price as unjust enrichment to Saline. But the retail investors never knew they had this right because the fact of the distribution was concealed. They were deprived of their rights.
Undermining investor protection
34. The series of transactions undercut the investor protection provided by the hold periods of Ontario securities law. It subverted those hold periods with the securities lending agreement.
35. Under the agreement, Saline and GHL swapped the restricted, private placement shares for free-trading ones. The agreement's term corresponded precisely to the hold periods. When the term was up, the agreement required: (a) Saline to deliver shares to GHL to pay off the loan; and (b) GHL to deliver shares to Saline since "collateral" was no longer required. Cormark and Kennedy suggested that the agreement require this exchange of shares for "better optics". In reality, this was not done. GHL just kept the shares it had held as "collateral" once the hold periods had expired. Further steps were unnecessary. The agreement had fulfilled its purpose. The securities loan was really a share swap to subvert the hold periods.
36. Hold periods are crucial for investor protection. They ensure that privately placed securities come to rest with purchasers who intend to invest in the issuer and prevent exactly the kind of "backdoor underwriting" exemplified by the series of transactions. Hold periods also ensure that, before the shares are resold to the public, a fresh set of financial statements and management's discussion and analysis will be available to inform purchasers' investment decisions. Instead, for more than three months, until the end of June 2017, the public traded in the shares in light of financial statements and management's discussion and analysis for the period ended December 31, 2016.
Threatening capital market efficiency and confidence
37. The series of transactions threatened the efficiency of Ontario's capital markets and confidence in them as an efficient pricing mechanism.
38. Saline's short sales were unlikely to contribute to an efficient trading price. They were motivated not by Saline's assessment of Canopy's value, but by the opportunity for virtually risk-free profits. The risk-free nature of those profits is a strong incentive to make these kinds of short sales, which may prevent a stock price from rising as much as it would have without the short sales or cause that price to decline. In the absence of disclosure, other investors may believe that the market activity is being driven by an evaluation of the issuer's merits and sell as well. This may result in further, unwarranted price declines around the times of offerings. Such price declines may reduce the proceeds shareholders receive in the secondary market. They may also reduce issuers' offering proceeds, inhibiting capital formation. Such short sales diminish the fairness, efficiency and competitiveness of, and confidence in, the capital markets.
Failing to meet high standards of fitness and business conduct
39. Cormark, Kennedy and Bistricer did not conduct themselves honestly or responsibly in accordance with the high standards applicable to registrants.
40. Each of Cormark, Kennedy and Bistricer was registered:
(a) Cormark was registered in Ontario as an investment dealer;
(b) Kennedy was registered in Ontario as a dealing representative of Cormark; and
(c) Bistricer was registered in Ontario as the ultimate designated person of Murchinson Ltd., an Ontario portfolio manager.
41. As registrants, Cormark, Kennedy and Bistricer were charged with upholding the integrity of the capital markets. Investment dealers like Cormark and representatives like Kennedy are critical gatekeepers in distributing securities to the public. Ultimate designated persons like Bistricer are responsible for promoting a culture of compliance with securities legislation. Instead of fulfilling these responsibilities, the three deployed their knowledge and skills to benefit themselves at the expense of the investing public and the capital markets.
42. The following breaches of Ontario securities law and conduct contrary to the public interest are alleged:
(a) the respondents distributed securities without filing a preliminary prospectus or a prospectus and without exemptions from the prospectus requirement, contrary to subsection 53(1) of the Act;
(b) Cormark and Kennedy failed to deal fairly, honestly and in good faith with their client, Canopy, contrary to section 2.1 of OSC Rule 31-505 Conditions of Registration;
(c) Kennedy authorized, permitted or acquiesced in Cormark's non-compliance with Ontario securities law, and is deemed to have failed to comply with Ontario securities law under section 129.2 of the Act;
(d) Bistricer authorized, permitted or acquiesced in Saline's non-compliance with Ontario securities law, and is deemed to have failed to comply with Ontario securities law under section 129.2 of the Act;
(e) as described in paragraphs 20 to 41, Cormark and Kennedy engaged in conduct warranting a public interest order under subsection 127(1) of the Act; and
(f) as described in paragraphs 28 to 30 and paragraphs 32 to 41, Bistricer and Saline engaged in conduct warranting a public interest order under subsection 127(1) of the Act.
43. These allegations may be amended and further allegations may be made, as the Capital Markets Tribunal (the Tribunal) may permit.
44. It is requested that the Tribunal make the following orders:
(a) that any registration or recognition granted to the respondents under Ontario securities law be terminated or suspended or restricted for such period as is specified by the Tribunal, or that terms and conditions be imposed on the registration or recognition, pursuant to paragraph 1 of subsection 127(1) of the Act;
(b) that the respondents cease trading in any securities or derivatives permanently or for such period as is specified by the Tribunal, pursuant to paragraph 2 of subsection 127(1) of the Act;
(c) that the respondents be prohibited from acquiring any securities permanently or for such period as is specified by the Tribunal, pursuant to paragraph 2.1 of subsection 127(1) of the Act;
(d) that any exemptions contained in Ontario securities law not apply to the respondents permanently or for such period as is specified by the Tribunal, pursuant to paragraph 3 of subsection 127(1) of the Act;
(e) that Cormark submit to a review of its practices and procedures and institute such changes as may be ordered by the Tribunal, pursuant to paragraph 4 of subsection 127(1) of the Act;
(f) that the respondents be reprimanded, pursuant to paragraph 6 of subsection 127(1) of the Act;
(g) that Kennedy and Bistricer resign any position he may hold as a director or officer of an issuer, pursuant to paragraph 7 of subsection 127(1) of the Act;
(h) that Kennedy and Bistricer be prohibited from becoming or acting as a director or officer of an issuer permanently or for such period as is specified by the Tribunal, pursuant to paragraph 8 of subsection 127(1) of the Act;
(i) that Kennedy and Bistricer resign any position he may hold as a director or officer of a registrant, pursuant to paragraph 8.1 of subsection 127(1) of the Act;
(j) that Kennedy and Bistricer be prohibited from becoming or acting as a director or officer of a registrant permanently or for such period as is specified by the Tribunal, pursuant to paragraph 8.2 of subsection 127(1) of the Act;
(k) that Kennedy and Bistricer resign any position he may hold as a director or officer of an investment fund manager, pursuant to paragraph 8.3 of subsection 127(1) of the Act;
(l) that Kennedy and Bistricer be prohibited from becoming or acting as a director or officer of an investment fund manager permanently or for such period as is specified by the Tribunal, pursuant to paragraph 8.4 of subsection 127(1) of the Act;
(m) that the respondents be prohibited from becoming or acting as a registrant, as an investment fund manager or as a promoter permanently or for such period as is specified by the Tribunal, pursuant to paragraph 8.5 of subsection 127(1) of the Act;
(n) that the respondents pay an administrative penalty of not more than $1 million for each failure to comply with Ontario securities law, pursuant to paragraph 9 of subsection 127(1) of the Act;
(o) that the respondents disgorge to the Ontario Securities Commission any amounts obtained as a result of the non-compliance with Ontario securities law, pursuant to paragraph 10 of subsection 127(1) of the Act;
(p) that the respondents pay the costs of the investigation and the hearing, pursuant to section 127.1 of the Act; and
(q) such other order as the Tribunal considers appropriate in the public interest.
DATED this 9th day of November, 2022.
Cormark Securities Inc. et al.
FOR IMMEDIATE RELEASE
November 9, 2022
TORONTO -- The Tribunal issued a Notice of Hearing on November 9, 2022 setting the matter down to be heard on November 23, 2022 at 10:00 a.m. or as soon thereafter as the hearing can be held in the above named matter.
A copy of the Notice of Hearing dated November 9, 2022 and Statement of Allegations dated November 9, 2022 are available at capitalmarketstribunal.ca.
For Media Inquiries:
For General Inquiries:
FOR IMMEDIATE RELEASE
November 15, 2022
TORONTO -- The Tribunal issued an Order in the above named matter.
A copy of the Order dated November 15, 2022 is available at capitalmarketstribunal.ca.
For Media Inquiries:
For General Inquiries:
File No. 2019-22
Adjudicator: |
Timothy Moseley |
November 15, 2022
WHEREAS the Capital Markets Tribunal held a hearing in writing to consider a request from Staff of the Ontario Securities Commission to vary the schedule set out in the Tribunal's order of October 21, 2022, relating to the exchange of materials for the sanctions and costs hearing in this proceeding;
ON READING Staff's request and on considering that no party opposes the request;
IT IS ORDERED THAT the October 21, 2022 order is varied, such that:
1. Staff shall serve and file written evidence, if any, and any witness summaries for oral evidence they intend to call at the sanctions and costs hearing, and written submissions on sanctions and costs, by 4:30 p.m. on December 16, 2022;
2. the respondents shall each serve and file written evidence, if any, and any witness summaries for oral evidence they intend to call at the sanctions and costs hearing, and written submissions on sanctions and costs, by 4:30 p.m. on February 9, 2023; and
3. Staff shall serve and file reply written evidence, if any, and written reply submissions on sanctions and costs, if any, by 4:30 p.m. on March 2, 2023.
OSC Staff Notice 11-796 Digital Engagement Practices in Retail Investing: Gamification and Other Behavioural Techniques
November 17, 2022
A priority of the Ontario Securities Commission (the OSC or we) is improving the investor experience and expanding investor protection through a range of initiatives{1}. Included in this are initiatives to support behavioural insights and policy testing capabilities. Reflecting this commitment, the Investor Office examined gamification and other behavioural techniques that are currently being used or may be used in the future by Order Execution Only or self-directed investment platforms as part of their digital engagement practices (DEPs). The report arising from this work (the Report) examines how the different gamification and other behavioural techniques may influence retail investors behaviours-both positively and negatively. The Report is appended to this staff notice (this Notice).
A wave of digital, mobile-friendly investing platforms has created new options for retail investors in Canada and around the world. While these platforms have expanded market participation, there is growing interest in some of the DEPs that they and, to a lesser extent, more traditional retail investment platforms use and how these may raise investor protection concerns. These tactics, sometimes referred to broadly as "gamification," use insights from behavioural science to influence investor behaviour.
Regulators have faced some challenges in understanding and responding to these developments, including: a lack of common terminology and definitions currently in use; an absence of a regulatory inventory of practices currently employed by Canadian (and US) dealers in the marketplace; and, limited direct testing and data as to effects of DEPs on shaping investor behaviour.
To respond to the above, the Investor Office undertook a behavioural science study on gamification and other behavioural techniques under the DEPs umbrella. The Report, which is appended to this Notice, is a result of this work and provides:
(i) a taxonomy of gamification and other behavioural techniques that are currently being used or may be used by online brokerages in the future and their likely impact on retail investor behaviour-both positively and negatively; and
(ii) the results of an online randomized controlled trial (RCT) experiment that examines the use of points and top traded lists to determine their impact on trading frequency.
The goal of this work is to assist the OSC, other regulators and stakeholders in understanding these new developments. In responding to the developments, we encourage taking an evidence-informed approach, using behavioural insights to facilitate the use of DEPs in a manner that supports good investor outcomes.
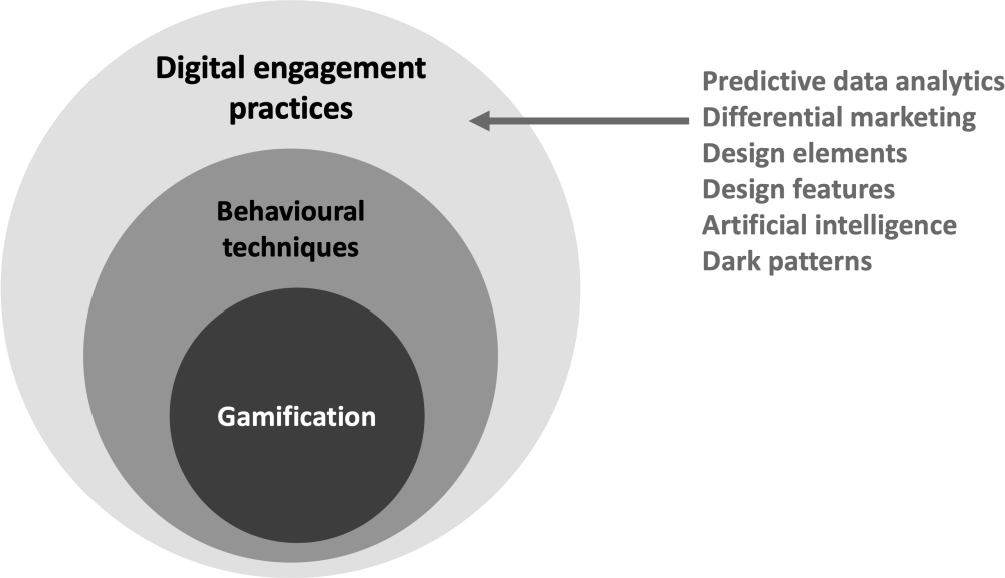
Gamification refers to a variety of behavioural techniques that integrate game-related elements into non-gaming contexts and applications, with the purpose of improving user experience and engagement. We use the term other behavioural techniques to refer to DEPs that use insights from behavioural science in ways that can influence investor behaviour but do not meet the definition of gamification. DEPs themselves are "the tools including behavioural techniques, differential marketing, gamification, design elements or design features that intentionally or unintentionally engage with retail investors on digital platforms as well as the analytical and technological tools and methods."{2} This definition highlights a range of potential tools, such as behavioural techniques, differential marketing, gamification, design elements, design features, and data analytics, that increase user engagement. There are other DEP tools beyond this definition as well, such as artificial intelligence and dark patterns.
The Report examines five gamification techniques used on self-directed investor platforms:
1. Gamblification: Techniques derived from gambling, which most prominently include the use of variable rewards. Variable rewards are economic benefits (e.g., cash payouts) where the size, timing, or likelihood of the benefit is unpredictable to the user. Beyond variable rewards, the gamblification category might also include language and imagery that evokes gambling (e.g., reference to "jackpots" or scratch cards).
2. Leaderboards: Public displays of ranked information about application users' performance. Leaderboards enable and encourage social comparison and competition.
3. Rewards (negligible or non-economic rewards such as points, badges, scores): Providing rewards for performing tasks or accomplishing goals within an online application. Our definition includes rewards with either no economic value or with nominal economic value that should not materially influence investor behaviour under a purely rational economic decision-making model.
4. Goal and Progress Framing: Design elements that i) help users set and visualize their goals, and/or ii) strategically frame users' performance and progress with respect to these goals to stimulate greater levels of engagement.
5. Feedback: The provision of information about a user's performance on a task in (near) real-time, including both continuous progress feedback and immediate success feedback.
The Report also examines four other behavioural techniques:
1. Salience / Attention-inducing Prompts: Information is more likely to influence people's behaviour if it attracts their attention.
2. Simplification and Selective Deployment of Friction Costs: The design of the user experience that reduces or introduces small barriers across the user journey, influencing the likelihood and manner in which a user completes a specific task. We use "simplification" to refer to reductions in small barriers and "friction costs" to refer to increases in small barriers.
3. Social Interactions: Design elements that enable platform users to interact with other users by i) generating, sharing, viewing, and reacting to content, and ii) engaging in direct messaging.
4. Social Norms: Design features which signal social norms (i.e., information about how others think and behave).
These techniques could be employed in a manner that has positive influences on retail investors such as:
• encouraging deposits to investment accounts,
• encouraging greater participation and learning of investor education modules on digital platforms,
• improving diversification of the investor's portfolio, and
• setting and monitoring progress towards long-term retirement savings goals.
However, these techniques also could have negative influences on investor behaviour such as:
• increasing risk taking by overweighting small probabilities,
• creating habit forming behaviours,
• invoking a psychological "hot" state that influences a user's subsequent behaviour such as the "hot hand" fallacy, making a person more likely to gamble with a windfall or unexpected bonus,
• increase trading frequency and risk-taking,
• increasing focus on shorter-term outcomes or trading activity that reduces longer term returns and/or undermines investment goals, and
• increasing investor's (over)confidence, negatively impacting investor performance.
We tested some of the techniques identified in the Report in a RCT. We conducted an online RCT with 2,430 Canadians to assess the impact of two techniques of interest on investing behaviours in a simulated trading environment: (1) giving investors "points" with negligible economic value for buying or selling stocks-a form of reward, and (2) showing investors a "top traded list"-a combination of attention-inducing prompts and social norms. The experiment was conducted online in a simulated real-world trading environment with Canadians aged 18-65 engaging through mobile, tablet or desktop devices.
Research participants received $10,000 in simulated "money" to invest in up to six different fictitiously-named stocks. After their initial allocation of funds, they were taken through seven simulated weeks of stock price movements, with an option to buy and/or sell stocks during each week. At the end of the experiment all participants received a fixed amount of compensation for participating in the experiment. They also earned additional compensation based on their balance at the end of the experiment. Participants were aware that the larger the value of their portfolio at the end of the experiment, the more they would earn. This created an incentive for participants to trade thoughtfully and to try to maximize their returns.
Importantly, participants who were rewarded with points made 39% more trades than participants in the control group (i.e., those who were exposed to the same trading simulation but without any gamification or other behavioural techniques). This statistically significant difference was found despite the fact that the points had negligible value. This is an important finding given that there is a strong negative impact of increased trading volume on investors' returns (on average){3}, and in light of the material benefit that may be gained by digital trading platforms from increased trading volume. Showing research participants a top traded list did not increase their trading frequency.
Furthermore, participants who saw the top traded lists were 14% more likely than participants in the control group to buy and sell those top listed stocks. This finding suggests that showing participants a top traded lists can affect their trading decisions, nudging them towards buying and selling the stocks listed as top traded, which is herding. There were no differences between the points group and the control group in terms of the buying and selling the top traded stocks.
These findings reinforce the importance of using behavioural science as a policy tool by regulators. Given the statistically significant findings derived from the RCT, the Report recommends that regulators consider the implications of the findings, including whether any of the gamification and other behavioural techniques examined have attributes similar to recommendations and/or result in investor behaviour that is (on average) detrimental to investor outcomes, and if so, consider possible responses.
The Report also recommends:
1. collecting more data to see the impact of gamification and other behavioural tactics through leveraging data collected by digital trading platforms, or through other experiments,
2. collecting evidence and data on strategies to mitigate negative impacts of DEPs to determine if mitigation approaches are effective (e.g., adding friction points), and
3. exploring positive impacts of gamification and other behavioural techniques to increase investing knowledge and level of expertise.
We encourage registrants to review the findings of the Report and consider the influence that their DEPs may have on their clients so that negative investor behaviours are not encouraged (whether inadvertently or otherwise), and to focus their use of DEPs in a manner that supports good investor outcomes.
We look forward to engaging with investors, registrants, and other stakeholders with respect to the Report's findings and our broader work to improve the investor experience and expand investor protection.
If you have any questions or comments about this Notice or the Report, please contact:
Tyler FlemingDirectorInvestor Office20 Queen Street West, 22nd FloorToronto, ON M5H 3S8Email: tfleming@osc.gov.on.caMarian PassmoreSenior Advisor, PolicyInvestor Office20 Queen Street West, 22nd FloorToronto, ON M5H 3S8Email: mpassmore@osc.gov.on.caMatthew KanSenior Advisor, Behavioural InsightsInvestor Office20 Queen Street West, 22nd FloorToronto, ON M5H 3S8Email: mkan@osc.gov.on.ca
[Editor's Note: The research report, "Digital Engagement Practices in Retail Investing: Gamification & Other Behavioural Techniques" is reproduced on the following internally numbered pages. Bulletin pagination resumes at the end of the report.]
{1} Ontario Securities Commission Business Plan for the fiscal years ending 2023-2025, available online at https://www.osc.ca/sites/default/files/2022-04/pub_20220426_osc-2023-2025-business-plan.pdf at p. 23.
{2} This definition is consistent with that of the U.S. Securities and Exchange Commission (SEC)'s definition found in Release Nos. 34-92766 Request for Information and Comments on Broker-Dealer and Investment Adviser Digital Engagement Practices, Related Tools and Methods, and Regulatory Considerations and Potential Approaches; Information and Comments on Investment Adviser Use of Technology to Develop and Provide Investment Advice at page 1, available online at https://www.sec.gov/rules/other/2021/34-92766.pdf.
{3} Barber, B. M., & Odean, T. (2000). Trading is hazardous to your wealth: The common stock investment performance of individual investors. Journal of Finance, 55(2), 773-806.
November 20222
Table of Contents
Table of Contents |
2 |
Executive Summary |
3 |
Key Findings |
5 |
Introduction |
7 |
Overview of Project Approach |
10 |
Key limitations |
11 |
Exploratory Research |
12 |
Exploratory Research Methodology |
12 |
Exploratory Research Findings: Taxonomy of Gamification and Other Behavioural Techniques |
15 |
Experimental Research |
36 |
Experimental Research Methodology |
36 |
Experimental Research Findings |
44 |
Conclusion: Considerations for Regulators |
48 |
Appendix A: Use of Gamification and Other Tactics on Trading Platforms |
50 |
Appendix B: Detailed Experimental Research Findings |
52 |
Appendix C: Experimental Research Analysis Technical Details |
62 |
Appendix D: Experimental Research Screens |
66 |
Appendix E: Bibliography |
79 |
A wave of digital, mobile-friendly investing platforms has created new options for retail investors in Canada and around the world. While these platforms have expanded market participation, there is growing interest in some of the digital engagement practices (DEPs) that they and, to a lesser extent, more traditional retail investment platforms use and how these may raise investor protection concerns. These tactics, sometimes referred to broadly as "gamification," use insights from behavioural science to influence investor behaviour.
Broadly, investing platforms use a wide range of DEPs to increase user engagement. They do this for a variety of business objectives (e.g., customer acquisition and retention, revenue, profitability) and not necessarily to improve long-term outcomes for their retail investors. Various regulators around the world have expressed concerns that some of these tactics may negatively impact investor outcomes. For example, the United States Securities and Exchange Commission (SEC) has flagged concerns that these features may encourage investors to trade more often, invest in different products, or change their investment strategy in inappropriate ways.{1}
The goal of this research report is to support the Ontario Securities Commission (OSC) and other regulators and stakeholders in understanding and responding to these new developments. This report aims to help chart an effective, evidence-informed path forward in the months and years ahead as digital trading platforms continue to evolve and grow.
The Behavioural Insights Team was engaged by the OSC's Investor Office to:
1. Generate a taxonomy of gamification and other behavioural techniques by conducting literature and environmental scans; and,
2. Conduct an experiment that examines the effects of gamification and other related behavioural techniques on retail investor behaviours.
We worked in close partnership with the Investor Office Research and Behavioural Insights Team (IORBIT) to develop the research parameters for the taxonomy, design and conduct an experiment using a randomized controlled trial (RCT), analyze the experimental data, and prepare this report. IORBIT's insights, advice, and feedback were critical to this project's success.
In this report, we examine gamification and other behavioural techniques to see how they affect investor behaviour-both positively and negatively. We outline a taxonomy of gamification and other behavioural techniques currently employed or with high relevance to retail investing, and their potential implications for investor behaviour. The five gamification techniques examined were: (1) gamblification, (2) leaderboards, (3) rewards (negligible or non-economic rewards such as points, badges, scores), (4) goal and progress framing, and (5) feedback. The four other behavioural techniques examined were: (1) salience / attention-inducing prompts, (2) simplification and selective deployment of friction costs, (3) social interactions, and (4) social norms. We also discuss the results of an experiment (an RCT) with 2,430 investors that simulated a real-world trading environment, in which we measured the effects of two digital engagement practices, points and top traded lists, on trading behaviour (e.g., trading frequency).
As the use of the terms digital engagement practices, behavioural techniques, and gamification have become increasingly popular, it is imperative for regulators to have a clear and common definition of these terms to allow for rigorous research and potential regulatory action. To navigate the DEP landscape, we have used the SEC's definition of DEPs (see Key Definitions, below) as a foundation. This definition highlights a range of potential tools, such as behavioural techniques, differential marketing, gamification, design elements, design features, and data analytics, that increase user engagement. There are other DEP tools beyond this definition as well, such as artificial intelligence and dark patterns. This report does not examine all such tools; it focuses on gamification and other behavioural techniques used in self-directed digital trading platforms. Figure 1 illustrates the relationship among DEPs, behavioural techniques, and gamification. Gamification techniques are a subset of behavioural techniques, which are in turn a subset of DEPs.
- - - - - - - - - - - - - - - - - - - -
Key Definitions
For the purposes of this report:
• Digital Engagement Practices (DEPs) are defined, consistent with the U.S. Securities and Exchange Commission, as "the tools including behavioural techniques, differential marketing, gamification, design elements or design features that intentionally or unintentionally engage with retail investors on digital platforms as well as the analytical and technological tools and methods."
• Gamification refers to a variety of behavioural techniques that integrate game-related elements into non-gaming contexts and applications, with the purpose of improving user experience and engagement.
• We use the term other behavioural techniques to refer to DEPs that use insights from behavioural science in ways that can influence investor behaviour but do not meet the definition of gamification.
• Digital trading platforms are websites, portals, and applications for trading securities that are available to retail investors through their phones, computers, tablets.
Figure 1: The relationship between DEPs, gamification, and other behavioural techniques. This illustration is a simplification as some overlap between these categories is not depicted.
- - - - - - - - - - - - - - - - - - - -
Key Findings
The Experiment
We conducted an online RCT to assess the impact of two gamification techniques of interest on investing behaviours in a simulated trading environment: (1) giving investors "points" with negligible economic value for buying or selling stocks, a form of reward, and (2) showing investors a "top traded list", a combination of attention-inducing prompts and social norms.
Participants who were rewarded with points made almost 40% more trades than participants in the control group (i.e., those who were exposed to the same trading simulation but without any gamification or other behavioural techniques). This is despite the fact that the points had negligible value. This is a striking finding given the strong negative impact of increased trading volume on investors' returns (on average) and the benefit of increased volume that may exist for digital trading platforms.{2} The "top traded list" did not increase trading frequency in our experiment.
In addition, participants who saw the top traded lists were 14% more likely than participants in the control group to buy and sell those top listed stocks. This finding suggests that showing participants a top traded lists can affect their trading decisions, nudging them towards buying and selling the stocks listed as top traded. There were no differences between the points group and the control group in terms of the buying and selling the top traded stocks.
Implications
Based on our findings, we recommend that regulators consider the implications for retail investors when digital trading platforms offer points for trading activity, as well as display top traded lists. More broadly, we encourage regulators to consider whether any of the gamification and behavioural techniques examined have attributes similar to recommendations and/or result in investor behaviour that is (on average) detrimental to investor outcomes. If so, then possible responses to these techniques should be considered. Furthermore, we encourage regulators to close the major gaps in empirical evidence by collecting more data. Such data can be generated by conducting more experimental studies using simulated investing platforms, and by reviewing the data from digital trading platforms that have implemented gamification or other behavioural techniques. These actions will enable the OSC and other regulators to set new empirically-driven regulatory strategies and approaches.
A wave of digital, mobile-friendly investing platforms has created new options for retail investors in Canada and around the world. While these platforms can increase access and expand market participation, there is growing regulatory interest in some of the digital engagement practices (DEPs) that they and, to a lesser extent, more traditional retail investment platforms use and how these may raise investor protection concerns. These tactics, sometimes referred to broadly as "gamification," use insights from behavioural science to influence user (investor) behaviour. Regulators are concerned that some of these tactics may negatively impact investor outcomes. For example, the United States Securities and Exchange Commission, (the "SEC") has flagged concerns that these features may encourage investors to trade more often, invest in different products, or change their investment strategy.{3}
Broadly, investing platforms use a wide range of Digital Engagement Practices (DEPs) to increase user engagement. They do this for a variety of business objectives (e.g., customer acquisition and retention, revenue, profitability) and not necessarily to improve long-term outcomes for their retail investors. Various regulators around the world have expressed concerns that some of these tactics may negatively impact investor outcomes. For example, the United States Securities and Exchange Commission (SEC) has flagged concerns that these features may encourage investors to trade more often, invest in different products, or change their investment strategy in inappropriate ways.{4}
The goal of this research report is to support the Ontario Securities Commission (OSC) and other regulators and stakeholders in understanding and responding to these new developments. This report aims to help chart an effective, evidence-informed path forward in the months and years ahead as digital trading platforms continue to evolve and grow.
While there is significant interest surrounding the use of gamification and other behavioural techniques, they are recent developments in the investing context, and there is little research into how they are affecting investor behaviour and decision-making. In this context, the Ontario Securities Commission (OSC) engaged the Behavioural Insights Team (BIT) to:
1. Generate a taxonomy of gamification and behavioural techniques by conducting literature and environmental scans of:
a. Relevant research into how gamification and other behavioural techniques can be used to influence retail investor behaviour, as well as key gaps in that research;
b. How firms serving retail investors are currently using these techniques in Canada and in select international markets; and
c. Other ways that firms may use gamification and other behavioural techniques in the future, given the approaches being used in other industries.
2. Conduct an experiment that examines the effects of gamification and other related behavioural techniques on retail investor behaviours.
We worked in close partnership with the Investor Office Research and Behavioural Insights Team (IORBIT) to develop the research parameters for the taxonomy, design and conduct an experiment using a randomized controlled trial (RCT), analyse the experimental data, as well as prepare this report. IORBIT's insights, advice, and feedback were critical to this project's success.
In this report, we examine gamification and other behavioural techniques to see how they affect investor behaviour-both positively and negatively. We outline a taxonomy of gamification and other behavioural techniques with high relevance to retail investing, and their potential implications for investor behaviour. We also discuss the results of an experiment (an RCT) with 2,430 investors that simulated a real-world trading environment, in which we measured the effects of two digital engagement practices (i.e., points and top traded lists) on trading behaviour (i.e., trading frequency).
As the use of the terms digital engagement practices, behavioural techniques, and gamification have become increasingly popular, it is imperative for regulators to have a clear and common definition of these terms to allow for rigorous research and potential regulatory action. To navigate the DEP landscape, we use the SEC's definition of DEPs (see Key Definitions, below) as a foundation. This definition highlights a range of potential tools for increasing user engagement. This report does not examine all such tools. For example, we do not examine the use of predictive data analytics, dark patterns, or artificial intelligence. Reflecting our expertise in behavioural science, this research focuses on gamification and other behavioural techniques used in self-directed digital trading platforms. Figure 2 illustrates the relationship between DEPs, behavioural techniques, and gamification. Gamification techniques are a subset of behavioural techniques, which are in turn a subset of DEPs.
- - - - - - - - - - - - - - - - - - - -
Key Definitions
For the purposes of this report:
• Digital Engagement Practices (DEPs) are defined, following the U.S. Securities and Exchange Commission, as "the tools including behavioural techniques, differential marketing, gamification, design elements or design features that intentionally or unintentionally engage with retail investors on digital platforms as well as the analytical and technological tools and methods."
• Gamification refers to a variety of behavioural techniques that integrate game-related elements into non-gaming contexts and applications, with the purpose of improving user experience and engagement.
• We use the term other behavioural techniques to refer to DEPs that use insights from behavioural science in ways that can influence investor behaviour but do not meet the definition of gamification.
• Digital trading platforms are websites, portals, and applications for trading securities that are available to retail investors through their phones, computers, tablets, or other technology.
The image below represents the relationship between DEPs, gamification, and other behavioural techniques, all of which can be implemented in digital platforms.
Figure 2: The relationship between DEPs, gamification, and other behavioural techniques. This illustration is a simplification as some overlap between these categories is not depicted.

- - - - - - - - - - - - - - - - - - - -
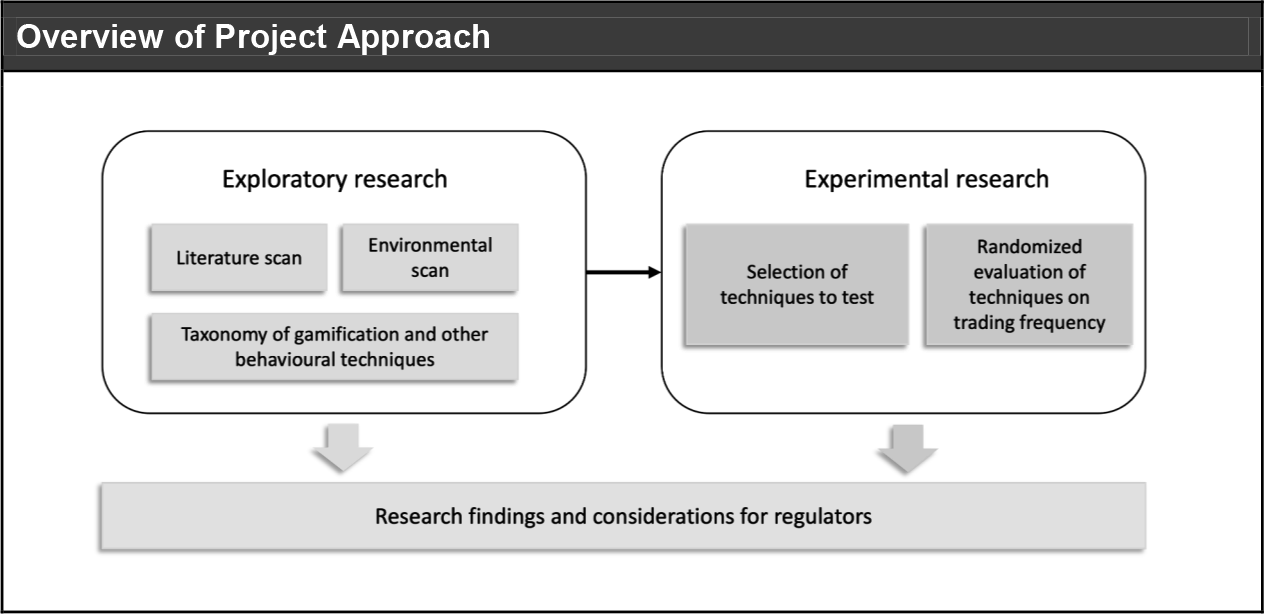
This project was conducted in two main phases: exploratory research and experimental research, as illustrated in the diagram below.
For the exploratory research, we conducted a scan and synthesis of relevant behavioural science to understand how gamification and other behavioural techniques may influence retail investor behaviour, in ways that both support and may negatively impact investor outcomes. We also reviewed select retail investor platforms, news articles, and various regulators' statements and reports to understand how firms in Canada and other select markets are currently using these approaches. Our exploratory research was summarized in a taxonomy that listed each current or potential technique being employed, their known or potential impact on investor behaviour, and their current use on investment platforms we reviewed.
In the second phase, we ran an experiment to empirically test the impact of two selected techniques on key investor behaviours. This experiment was designed to address key gaps in the existing evidence base.
As a final step in our process, we developed a set of considerations for regulators informed by both streams of research.
Figure 3: Overview of the exploratory and experimental research approaches
Overview of Project Approach
This section summarizes the most important limitations of this research report. Following sections provide more detailed accounts of limitations related to each research methodology.
1. This report is not exhaustive in identifying how gamification and other behavioural techniques are being used on investment platforms today. The proliferation of platforms, limitations in access to platforms and ability to engage in trading activity, and the bounded timelines for this review prevent an exhaustive report. However, we believe it reflects a reasonable cross-section of the techniques being used by self-directed investing platforms.
2. While we have tried to identify likely uses for gamification and other behavioural techniques beyond what we found in our review, operators of digital trading platforms are likely to identify further applications that this report does not consider.
3. There are a vast number of unanswered empirical questions about how DEPs influence investor behaviour. Our experiment had to select a limited number of techniques to test and behaviours to measure. Further, our experiment was conducted in a controlled environment, an investing simulation. Participants in the experiment did not use real funds and traded in fictitious equities. However, the use of a robust experimental method (i.e., an RCT) provides us with confidence in terms of the validity of our findings and our ability to generalize them to real-world trading. In addition, research participants were compensated based on their returns, and other aspects of the simulation were carefully designed to enhance its generalizability.
This section summarizes the methodology and findings from our exploratory research, which included a literature scan and environmental scan.
We applied a mixed-methods approach to address two exploratory research questions:
1. How do gamification and other behavioural techniques influence investor decision-making?
2. How are firms serving retail investors currently using or planning to use these techniques?
Methods included a literature scan and environmental scan. The literature scan provided a theoretical foundation by identifying and summarizing 31 items of relevant behavioural science and economic literature related to gamification, other behavioural techniques, and retail investing. The environmental scan conducted September 7 -- October 1, 2021, provided context on the extent to which firms serving self-directed retail investors are applying these techniques. It included a direct observation of 12 self-directed retail investor platforms (which have been anonymized and numbered Platforms 1 to 12 for the purposes of this report), and a further review of 16 news articles and statements. Both methods informed the development of a taxonomy of gamification and other behavioural techniques for retail investing platforms. This taxonomy summarized each current identified technique, their known or potential impact on investor behaviour, and their current use on the investing platforms we reviewed. More information on each part of our exploratory research method is captured in the table below:
Exploratory Research Activities: Overview of Methodology |
|||
|
|||
Literature Scan |
• |
The literature scan began by conducting research database searches for key terms (e.g., investing, gamification), then used a "snowball method", whereby we reviewed the sources cited by relevant papers. The search was also expanded to identify non-peer reviewed (grey literature), internal BIT resources, and sources recommended by the OSC. |
|
|
|||
• |
Key methodological considerations for the literature scan included: |
||
|
|||
• |
Defining gamification: Gamification is an umbrella term used to describe the integration of game-related elements into non-gaming contexts and applications, with the purpose of improving user experience and engagement.{5} Gamification has become an increasingly popular design component of applications that do not constitute games, such as apps aimed at helping users keep track of their weight loss goals, learn new languages, or trade securities. It is used broadly to increase engagement with digital applications and to increase the behaviours encouraged by those applications (e.g., studying, exercising). |
||
|
|||
• |
Exploring gamification research: Published academic research on gamification is concentrated in two sectors, education and health. While this may reflect greater use of gamification in these sectors, it may also be that researchers are more likely to conduct experiments and receive data in these domains. While our literature scan prioritized the more limited research related to investor behaviour, we integrated findings from other fields where we believed it would be relevant across user contexts. |
||
|
|||
Environmental Scan |
• |
To conduct the environmental scan, we collaboratively identified 12 self-directed retail investing platforms of interest (both Canadian and international) with the OSC and went through the process of registering for an account, keeping a record of gamification and other behavioural techniques identified throughout the user experience within each platform. Where it was not possible to register for accounts with platforms based outside of Canada, we reviewed videos on YouTube highlighting the features of each of these apps and how to use them. We did not execute any trades on these platforms. |
|
|
|||
• |
We also reviewed a range of other sources, including news articles and statements by regulators for further information on how these platforms may be using (or planning to use) gamification and other behavioural techniques. |
||
|
|||
• |
Our scan excluded banking and financial management platforms that do not enable trading in securities. |
||
|
|||
• |
See Appendix A for a table summarizing which gamification and other behavioural techniques were observed on each platform reviewed. |
||
|
|||
Taxonomy of Gamification and Other Behavioural Techniques |
• |
Synthesizing the findings from the literature and environmental scans, we developed a taxonomy of gamification and other behavioural techniques that outlines how each technique has been shown to (or plausibly might) impact specific retail investor behaviours or choices. Investor behaviours of interest included enrolling in the platform, engagement with the platform, deposits, and a wide range of trading-related behaviours like trading frequency and risk-taking. |
|
|
|||
• |
As noted above, there is no authoritative list or common understanding of what constitutes a gamification technique in the context of investing platforms. The most widely accepted definition of gamification, "the use of game-design elements in non-gaming contexts", is broad and does not clearly identify what counts as a gamification technique. Systematic reviews of gamification techniques employ varying taxonomies. Securities regulators tend to understand gamification very widely, including concepts from behavioural science (e.g., attention-inducing prompts like notifications) that are not generally understood to be part of gamification. To address these challenges, we developed our own taxonomy of gamification and other behavioural techniques that are most relevant to retail investing platforms. |
||
|
|||
• |
We developed an initial list (i.e., taxonomy) of gamification techniques based on three widely cited meta-analyses / systematic reviews of gamification.{6},{7},{8} This initial taxonomy was further refined after conducting our environmental scan; we eliminated certain techniques that did not appear to be relevant to investing platforms (such as chatbots, avatars, or fantasy themes). Our environmental scan also revealed that certain other behavioural techniques that do not meet the traditional definition of gamification are often discussed alongside gamification tactics and used widely on investing platforms. We included those techniques, like attention-inducing prompts, in a separate section of our taxonomy and define them as other behavioural techniques. |
||
|
|||
• |
The widespread use of gamification on investing platforms is a new phenomenon that is rapidly escalating and shifting. We believe that new techniques are likely to be deployed by firms operating platforms. Given the overall purpose of this report in supporting regulatory strategy, we did not want to constrain our taxonomy and considerations solely to techniques that have already been implemented. Where we speculate on further potential use cases, we clearly note that such approaches are not yet in effect. We draw conclusions on the potential impact of both current and potential approaches based on our theoretical and empirical findings. Given the importance of specific implementation features and context, we cannot draw definitive conclusions on how gamification techniques are likely to affect investor behaviour across platforms. As supported by the existing research and our own experiment (see section below), we draw inferences on the likely impacts of these techniques on trading frequency, risk appetite, and other aspects of investing behaviour. |
||
{5} Deterding, S., Dixon, D., Khaled, R., & Nacke, L. (2011, September). From game design elements to gamefulness: defining" gamification". In Proceedings of the 15th international academic MindTrek conference: Envisioning future media environments (pp. 9-15).
{6} Hamari, J., Koivisto, J., & Sarsa, H. (2014, January). Does gamification work?--a literature review of empirical studies on gamification. In 2014 47th Hawaii international conference on system sciences (pp. 3025-3034).
{7} Looyestyn, J., Kernot, J., Boshoff, K., Ryan, J., Edney, S., & Maher, C. (2017). Does gamification increase engagement with online programs? A systematic review. PloS one, 12(3), e0173403.
{8} Johnson, D., Deterding, S., Kuhn, K. A., Staneva, A., Stoyanov, S., & Hides, L. (2016). Gamification for health and wellbeing: A systematic review of the literature. Internet Interventions, 6, 89-106.
The following taxonomy includes nine techniques informed by behavioural science that are relevant to investing platforms. For each technique we provide: (1) a definition, (2) a summary of how it is being used across industries and its general impact on user behaviour, and (3) description of how it is being used in investing platforms and its impact on investor behaviour and/or how it might be used and affect investor behaviour.
Gamification Techniques
Gamification refers to a variety of behavioural techniques that integrate game-related elements into non-gaming contexts and applications, with the purpose of improving user experience and engagement. Gamification techniques represent a subset of behavioural techniques, which are a subset of (DEPs).

Figure 4: A modified version of Platform 7's rewards, which give "surprise stocks" with variable value to first-time users when they sign up for an account and to users who refer a friend
Gamblification
Definition: Gamblification refers to techniques derived from gambling, which most prominently include the use of variable rewards. Variable rewards are economic benefits (e.g., cash payouts) where the size, timing, or likelihood of the benefit is unpredictable to the user. Beyond variable rewards, the gamblification category might also include language and imagery that evokes gambling (e.g., reference to "jackpots," scratch cards).{9}
General use and impact on behaviour: Gamblification has been used to encourage a broad set of behaviours ranging from user-platform engagement{10} to vaccination{11}. For instance, Google Pay gives users virtual scratch cards worth up to $10 in cash rewards as a variable reward for using this payment option. In Canada, Tim Hortons' "Roll Up the Rim" contest is a famous example of a retailer leveraging variable rewards to motivate purchasing behaviour.
Lotteries and other variable reward interventions can be potent drivers of behaviour for three main reasons:
1. Their combination of high-impact rewards and generally low win probabilities taps into our tendency to disproportionately focus on reward magnitude{12} and overweight small probabilities.{13}
2. The inherent uncertainty of variable rewards is habit-forming. Decades of research have found that animals trained to perform behaviours such as pressing levers{14} or seeking drugs{15} using variable rewards learn these behaviours much more readily than those trained with consistent reward schedules. Such animals are also known to be particularly resistant to so-called behavioural extinction{16},{17}, meaning that they continue performing their conditioned behaviours long after they are no longer being reinforced. Indeed, variable reward schedules are often used to simulate and study addiction in research settings,{18} and are thought to be responsible for the addictiveness of gambling.{19}
3. Variable rewards and other incentives couched in language reminiscent of gambling can invoke a psychological "hot" state that influences a user's subsequent behaviour. For instance, when an investment is framed as a "jackpot" entry, our decision-making becomes dominated by considerations of reward magnitude and less sensitive to realistic chances.{20} The results of a gamble can further distort our judgements, with one study showing that winning on a gamble makes us 80% likely to continue with the next gamble, compared to 20% after a loss.{21} This behaviour is thought to stem from a flawed assumption that a win signals a streak where future positive outcomes are more likely than before (also known as the hot hand fallacy).{22}
Current use on digital trading platforms and impact on behaviour: Gamblification strategies are present on several digital trading platforms. Platform 7 gives "surprise stocks" with variable value to first-time users when they sign up for an account and to users who refer a friend. Notably, the free stocks are presented in the form of a scratch card, where users are presented with an option of three scratch-off tickets and must choose one to "scratch" their fingers across the phone screen to see what they've won. Platform 10 users have to click on a virtual present to reveal the prize that they have "won" for referring a friend, the value of which also varies. The platform then presents users with a list of three potential stocks for them to invest in with the referral bonus. This list of three stocks makes it more likely the user will choose one of those stocks instead of other securities that could be more suitable, given the increased salience and reduced friction of purchasing them. Users do not have to invest the referral bonus in these three stocks, but the approach increases the likelihood that they will. Platform 10 also uses variable rewards for new users, offering the cash equivalent of a stock worth up to $4500. The free stock bonus has a value between $5 and $4500 with an average of $15.{23}
Given the evidence on variable rewards more broadly, we expect that these approaches are likely to increase platform sign-ups by offering a large potential bonus and increase the frequency of referrals. We also believe that these experiences may increase the likelihood of ongoing use of the application.
Beyond the immediate behaviour being rewarded, there are reasons to believe that gamblification tactics can change subsequent financial decisions as well. We are significantly more likely to gamble on money that feels like a windfall or unexpected bonus,{24},{25} like a large variable reward. These rewards may increase retail investor risk taking after receiving the bonus, especially where the bonus is unexpectedly large. There are two underlying effects. First, the "house money" effect describes how gamblers are less concerned about losing their winnings than losing their own money, their pre-existing stake.{26} Second, those who receive an unexpectedly large award may be influenced by the "hot hand fallacy",{27} the feeling that one is on a "hot streak" and that things are going to continue going well. This might motivate higher levels of trading activity than users might otherwise engage in.
Potential use on digital trading platforms and impact on behaviour: In the future, digital trading platforms may provide variable rewards for other behaviours, including deposits and trading (e.g., based on the volume or type of trades made). For example, users might be awarded an additional entry into a high-stakes lottery for every trade they carry out. If implemented, the evidence on variable rewards suggests this could have an outsized effect on trading frequency, surpassing the value of a fixed incentive per trade. Trading frequency or volume is a critical behaviour of interest, given the strong negative correlation with investor returns{28} and the incentives platforms can have to see higher trading volume. In terms of deposits, variable rewards would likely result in increased deposit behaviours within a specific account.
Leaderboards
Definition: A public display of ranked information about application users' performance. Leaderboards enable and encourage social comparison and competition.
General use and impact on behaviour:Leaderboards are one of the most common gamification tactics across digital platforms and apps in a variety of industries.{29} By offering users the opportunity to see and show their peer groups where they stand relative to others, leaderboards tap into our desire for recognition and innate tendency for social comparison and competition.{30},{31}
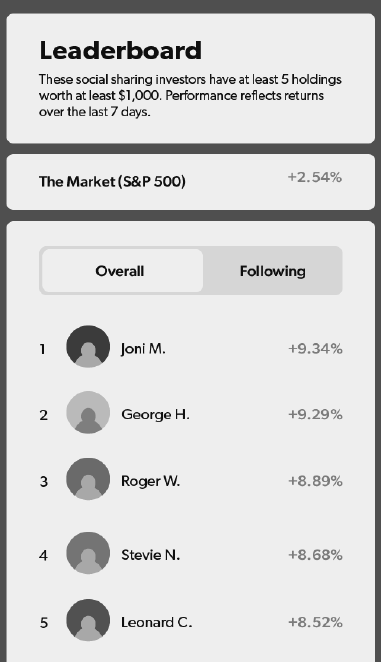
Figure 5: A modified version of Platform 8's social investing features, which rank users on a leaderboard based on weighted returns within a certain time frame.
A 2017 meta-analysis (a statistical analysis that combines the results of multiple scientific studies that address the same question and increases the confidence in the results) indicates that leaderboards are among the most effective gamification tactics, often outperforming other approaches like points and badges and generating small-to-medium-size effects compared to control conditions.{32} In one study focused on educational outcomes, researchers found that gamifying an online learning platform with leaderboards (alongside several other tactics), resulted in a 25% increase in student retention, as well as 23% higher average test scores compared to those produced by control conditions.{33} Another study found that leaderboards alone led to approximately 40% higher levels of user activity in a gamified image annotation task compared to control conditions, which was approximately 4% and 16% more than researchers were able to achieve with levels and points, respectively.{34}
Indeed, commercial platforms frequently use leaderboards to enhance user participation, with particular prevalence within the fitness app industry, where platforms such as Strava and Nike+ track and rank users based on running mileage and other parameters of performance. It is worth noting, however, that inducing a competitive spirit may not have the same effects on everyone and may in fact disadvantage the performance of individuals who are intrinsically less competitive.{35}
Current use on digital trading platforms and impact on behaviour: Leaderboards are a relatively rare feature of digital trading platforms. US-based Platform 8 offers the option to enable social investing, allowing users to compare how they are doing with their peers by featuring on a leaderboard where users are ranked based on returns weighted within a certain time frame. Users must meet certain criteria to feature on the leaderboard, including owning at least a minimum number of holdings worth at least a certain combined valued to dissuade members from copying deceptive results from other users (e.g., a massive return solely from one penny stock).
Platform 2 features multiple types of leaderboards. As an example, users have access to an "Editors' choice" leaderboard of investors to follow and copy, as well as a leaderboard of the most copied investors on the platform. Users are also invited to try joining the Platform 2's "Popular Investor Program" which allows successful joiners to generate an income from being copied by other users. As of September 2021, we did not identify any Canadian platforms using leaderboards.
Leaderboards have not been evaluated in a trading context in the academic literature. However, the studies conducted in other contexts, mentioned in the section above, suggest that leaderboards can be expected to increase user engagement with digital trading platforms. This may increase trading frequency and risk-taking, particularly in users who are more motivated by social comparisons{36} and competition than their longer-term financial goals. Leaderboards may also implicitly signal a social norm (see section below) around striving for and celebrating high financial performance. Here, frequently changing leader names may be viewed as the culmination of an ongoing competition, and a sign that this contest is desirable and popular. The impact of this is likely to depend on the salience of the leaderboard, whether economic or non-economic rewards are tied to leaderboard performance, and the type of returns or activity that the leaderboard represents. Leaderboards that focus on shorter-term returns, like Platform 2's 12-month returns, may increase myopic, speculative trading. Traders with a ranking on the leaderboards may also experience increased (over)confidence, which negatively impacts returns from trading.{37}
Potential use on digital trading platforms and impact on behaviour: In the future, digital trading platforms could implement additional leaderboards for other types of investor behaviour, such as trading frequency or even social interactions like "posts" or "likes" (see following section). Displaying a leaderboard that measures activity could clearly increase the frequency of trading. As described further below, even leaderboards for social interactions may be deceptively risky, given how strong an influence on behaviour social feedback and recognition can be. On the other hand, leaderboards for completing investor education modules, where offered by digital platforms, could encourage greater participation and learning.
Rewards (e.g., points, badges, scores)
Definition: Providing rewards for performing tasks or accomplishing goals within an online application. Our definition includes rewards with either no economic value (e.g., badges, scores, animations) or with nominal economic value (e.g., points that can be redeemed for an insignificant financial value) that should not materially influence investor behaviour under a purely rational economic decision-making model. This category excludes larger financial rewards (e.g., cash bonuses or points that can be redeemed for significant financial value), as they constitute a traditional incentive, not a "behavioural" intervention.

Figure 6: A modified version of Platform 8's rewards program, which rewards users with points for completing various in-app actions, such as checking your credit score
General use and impact on behaviour: Providing rewards like points, badges and scores are among the most commonly used gamification tactics.{38} While these rewards can have little or no economic value, they can still have a significant effect on consumer / user behaviour, promoting engagement in online programs{39} and influencing consumer behaviour.{40} For example, the Nike+ app awards "NikeFuel points" for completing physical activity tasks. These techniques motivate behaviour through social comparison (see Leaderboards, above) and our intrinsic desire to make progress, even if the measure is arbitrary.
Badges, in particular, are popular features of apps and online programs. They act as publicly visible signs of status within the network of application users. Amazon marks individuals as "top reviewers" when enough other users mark their reviews as helpful. A "pre and post" evaluation of the web platform "Sharetribe" found that badges increased user posts, page views, and transactions.{41} In a commercial context, retailers have long offered loyalty points and programs. While these points can generally be redeemed for goods and can be considered a traditional economic reward, their impact on behaviour outstrips their pure economic value as people tend to overvalue points they collect.{42} Not only are they overvalued, the mere decision to redeem a reward significantly increases purchase behaviour before and after the redemption event.{43} However, studies examining the effect of badges exclusively on engagement with online programs have found only small effect sizes.{44}
Current use on digital trading platforms and impact on behaviour: An American financial platform, Platform 8, uses points to reward users. Platform 8 is differentiated from other investing platforms by providing a wide range of financial products and services on one platform, including investing options, credit cards, loans, insurance, bank accounts, credit score information, budgeting tools, etc. While points are not given for investing behaviours, users can earn "Platform 8 points" for actions like spending money with the credit card or signing into the app on a daily basis and on consecutive days. The economic value of the Platform 8 points is quite limited. For example, users are rewarded with 1 point for a daily app login, and each Platform 8 point is worth $0.01. The earned points then can be converted into fractional shares of stocks within the investing component of Platform 8's digital platform, converted into cryptocurrency within the digital assets component of the platform, turned into cash, used towards loans, or used as credit towards the Platform 8 credit card. Enabling users to apply their points on traditional securities or crypto investments may be a particularly effective way to get non-investors to use these components of the Platform 8 digital platform.{45} It leverages the concept of 'mental accounting', which describes how people tend to treat money differently based on subjective criteria, such as its source. They may, for example, be more willing to take on risk with "bonus money" than money from other sources (e.g., employment income).
Another US-based personal finance app has taken a slightly different approach. They reward users with a percentage of their debit card purchases back in stock. For example, when a user spends money at Walmart, Amazon, or Starbucks, they earn fractional shares in these companies. When they spend at a smaller business, such as a local restaurant, they earn an investment of their choosing, either a stock or an ETF. The app's company's analysis suggests that one-third of customers using this reward card go on to make a follow up investment in the given stock or fund.{46} While offering users automated investments in the market is not negative for investors, this type of reward system may reduce diversification.
In a much simpler use of rewards, Platform 7 previously showered users' screens with digital animations to celebrate certain actions like placing a first trade or successfully referring friends. A 2021 experiment tested how gamification techniques, including confetti bursts, achievement badges, and messages of encouragement influence users' risk taking when trading. Participants in the experiment were assigned to trade virtual assets on either a simple experimental platform that mimics a retail investing app or a gamified version.{47} In each round, participants were given a virtual asset that they can sell at any time. Every two seconds, the asset price either increased by a random amount or, with a small probability that varied each round, crashed to zero. Users who traded on the gamified version of the platform took on significantly more risk. For example, they waited 14% longer to sell in the gamified version. The impact of gamification was stronger for high-risk environments (i.e., for assets that had a higher probability of crashing). Increasing the probability of a crash from 2% to 5% led to a 246% stronger impact of gamification on risk taking. In addition, the effect was stronger for inexperienced traders with lower financial literacy; a one standard deviation increase in a financial literacy score reduced the impact of gamification by 56%.
Potential use on digital trading platforms and impact on behaviour: Trading platforms could introduce points / scores or badges as a way to potentially motivate a wide range of investor behaviours. For example, badges could be awarded for purchasing different types of securities (e.g., options) or points could be awarded on a per-trade basis. Digital platforms might consider enabling users to "cash in" these points for small rewards (e.g., fractions of stocks, gift certificates, etc.) or keep them purely nominal. Small rewards are likely to have a larger impact on investor behaviour, given that they could be overvalued as being economically significant, and would have some financial cost to the digital platforms.
There may also be opportunities for investing platforms to deploy trading-related rewards in ways that are more likely to benefit users. For example, they could award points for improving the diversification of the investor's portfolio (e.g., across asset classes or sectors).
Goal and progress framing
Definition: Design elements that i) help users set and visualize their goals, and/or ii) strategically frame users' performance and progress with respect to these goals to stimulate greater levels of engagement.
General use and impact on behaviour: Diverse goal and progress framing tactics are being used across industries (e.g., air travel, food & drink, health apps) to motivate two primary types of engagement behaviours: i) purchasing and consumption, and ii) work and productivity. For example, flight miles programs motivate consumption by strategically framing their customers' flight histories as progress towards a particular goal. One study has found that reminding customers of how close they are to unlocking rewards associated with hitting an arbitrary points target can make them 55% relatively more willing to agree to receive marketing content in exchange for bonus miles, compared to when they are further from that threshold.{48}

Figure 7: Uber has used progress framing to encourage drivers to continue driving
In a practice that has attracted some controversy, Uber uses goal framing tactics to nudge their workers to keep driving beyond their desired log-off times.{49} When drivers are about to log off for the day, the app alerts them to how close they are to their daily income target (or a target which the company took the liberty to set for them) and encourages them to continue working. Although an absence of publicly available data from these interventions makes it difficult for us to specify the magnitude of the behavioural effect, the aggregate evidence suggests that goals (even arbitrary ones), influence behaviour across a range of activities.
How companies or apps choose to present an individual's progress toward a goal is also impactful. First, the closer we think we are to a goal, the more effort we are willing to expend to achieve it, a concept called the goal-gradient hypothesis. Our perceived proximity to a goal can be manipulated through "endowed progress." People getting a "Buy 12 coffees, get 1 free" card, with two of these coffees already pre-stamped buy more coffee than those getting a "Buy 10 coffees, get 1 free" card even though the actual proximity to the goal, buy 10 more coffees, is the same.{50}
Second, a theory known as the small area hypothesis states that "individuals in pursuit of a goal exhibit stronger motivation when they focus on whichever is smaller in size: the area of their completed actions or their remaining actions needed to reach a goal."{51} This means that if a user is 10% of the way to a goal, it's more motivating to focus their attention on the 10% they have accomplished than the 90% they haven't. Conversely, if they are 90% of the way to a goal, it is more motivating to focus on the 10% remaining than the 90% complete. One study of the behaviours of over 90,000 members of an online Q&A community has found that small-area progress framing accounted for a minimum of 78% increase in user activity and engagement after the platform was restructured.{52}
"Streaks" are another popular tactic used to frame progress. Derived from the concept of "winning streaks" in sports, they are used as a measurement of how consistently a user completes a specific action. For example, Duolingo refers to streaks in their language-learning platform, where users grow their streak for each day in a row they complete a lesson. An analysis of this feature has revealed that the streaks help increase users' attention to their learning purpose when the challenges increase and improves motivation.{53} Winning streaks were also shown to increase in perceived attractiveness with greater length. The effectiveness of this feature has been noted by other industries: mobility service providers such as Uber and Lyft distribute so-called "streak" or "consecutive ride" bonuses to motivate their driver employees.{54}
Current use on digital trading platforms and impact on behaviour: Our environmental scan did not identify any platforms using goal & progress framing tactics as defined in this report.{55}
Potential use on digital trading platforms and impact on behaviour: Given the clear relevance to financial decision-making, we believe it is likely that digital trading platforms will introduce goal-setting and goal-framing features. While platforms offering effectively self-directed investment services are prohibited from offering recommendations, they could permit investors and financial consumers to set out their financial goals and measure progress.
The way in which companies choose to solicit and define their users' goals and frame their progress will shape the behaviours that result. Helping users set and monitor progress against retirement savings goals, for example, could help instil a long-term investment outlook. However, such interventions would still need to be paired with clear guidance regarding the impact of increased trading frequency on long-term outcomes{56} to help mitigate the risk that people think more active trading approaches will support long-term goals. Similarly, goal framing should be attentive to other key aspects of successful personal investing, including diversification, savings rates, risk taking, possible need for funds for short-term emergencies, etc. Beyond encouraging long-term thinking, platforms could help users break down their goals into manageable sub-goals to support goal attainment.{57} On the other hand, setting goals related to shorter-term outcomes or trading activity could be harmful. For example, setting monthly goals for investment returns could lead to more risk-seeking choices.
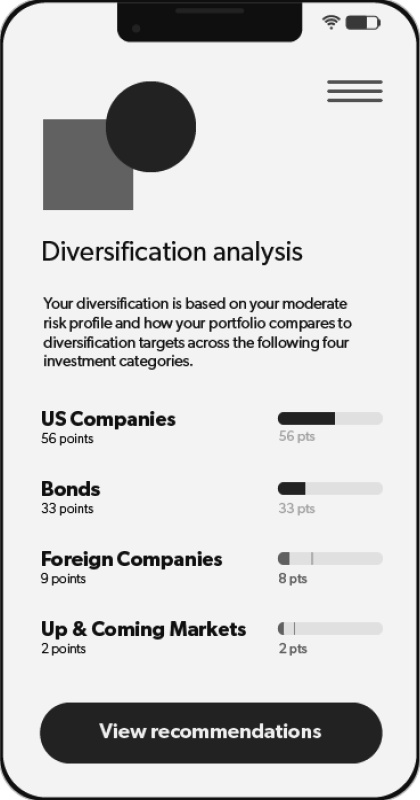
Figure 8: A modified version of a US-based app's tool for diversification analysis gives users a diversification score based on investments held in their portfolio
Feedback
Definition: The provision of information about a user's performance on a task in (near) real-time, including both continuous progress feedback and immediate success feedback.{58} We exclude feedback from other users in this category, as it is covered under Social interactions.
General use and impact on behaviour: Feedback has been most commonly applied in education contexts, where the frequency, intensity, and immediacy of feedback is found to be helpful for learner engagement and learning effectiveness.{59} A recent meta-analysis indicates a medium effect of 0.48 standard mean difference (SMD) of feedback on student learning outcomes.{60} While less common in non-education domains, Uber provides continuous progress feedback to its drivers (e.g., trips taken, money earned, rating) as part of a broader package of gamification techniques.{61} Data on the impact of feedback to Uber drivers is not publicly available.
Feedback has been used to facilitate more responsible gambling on online platforms. Players on the online gambling platform Norsk Tipping were randomly selected to receive personalized feedback, receiving details on their losses over the last month. Compared to a control group, the players who received the feedback reduced their theoretical loss, the amount of money they would be expected to lose based on the amount wagered and the house advantage on a given bet type, and amount of money wagered.{62}
The Canadian company Sun Life previously offered Money UP, an online platform that aims to educate consumers on retirement and investing planning by challenging users to pass levels by demonstrating financial knowledge while receiving quick feedback about their answers to questions on quizzes about these topics.
Feedback is effective because it serves as a self-regulation strategy, revealing progress in relation to goals,{63} and because it motivates changes in behaviour by focusing one's attention on the task itself.{64} It can be effective in influencing any behaviour that is the subject of that feedback, although in most cases feedback is used to help people improve at a task.
Current use on digital trading platforms and impact on behaviour: A US-based personal finance app has a tool for diversification analysis that gives users a diversification score based on their investments held in their portfolio, along with recommendations for "handpicked" investments that can help the user diversify. The app's evaluation of this feature found that those who engage with this tool have portfolios that are two times more diversified on average than those who do not.{65}
A Canadian online trading platform has also recently launched a tool that examines investors' portfolio, which measures users' portfolio holdings across four key indicators, including asset allocation, diversification, security ratings, and risk, and provides a report highlighting strengths as well as aspects the user may want to reconsider.
An US-based robo-advisor app uses timely feedback to provide users with the estimated tax impact of a withdrawal (or allocation change) "just in time," before the user commits to the transaction. The company behind the app indicates that the feature is effective in reducing allocation changes-noting that users shown an anticipated tax of $5 or more were 62% less likely to complete an allocation change compared to those who were not.{66} This illustrates the power of timely feedback in influencing investor behaviour.
Researchers have also shown how a feedback intervention can help investors mitigate cognitive bias in trading decisions. In one study, investors played investing "games" in a simulated environment hosted on an external learning platform. They received feedback on their emotional regulation and the cognitive biases they exhibited. This training had a significant, positive impact on reducing the observed disposition effect when these investors later made trades in the real world.{67} The disposition effect refers to the general tendency of investors to sell securities that have increased in value and hold on to securities that have gone down in value. Stakeholders within the field have varying views of simulated trading educational games; some feel they provide a good introduction to trading, while others fear they may increase short-termism.{68}
Potential use on digital trading platforms and impact on behaviour: Trading platforms could use feedback in other ways to support investor education and decision-making. Where platforms help users understand how trades work, how to analyze market data and risk, how to understand their fees and performance, and other investment-related behaviours, feedback is likely to support learning engagement and effectiveness. They could even provide users with a simulated trading environment and provide feedback to help users learn about common trading mistakes (e.g., frequent trading, under-diversification, myopia, disposition effect, etc.)-an approach tested by researchers.{69} As noted above, the value of such approaches is disputed and should be rigorously evaluated before full-scale implementation.
Beyond investor education, platforms could implement feedback on investors' real-world trading behaviour. For example, they could offer continuous progress feedback through more frequent reports on how investors are progressing against their savings goals. However, more frequent feedback might cause investors to focus too strongly on the short-term. A large-scale field experiment has shown that individuals who receive information about their investments' performance too frequently tend to underinvest in riskier assets, losing out on potential gains in the long-term.{70} Similarly, immediate success feedback on trades, like highlighting when investors exit a position at a profit, would likely reinforce investors' disposition effect, reducing future returns. Where the performance / feedback has been positive, it could also increase traders' (over)confidence, which, as noted above, negatively impacts investor performance. Investing is complex, and the impact of different types of feedback will vary depending on the context and the investor.
Overall, we believe there is sufficient evidence to suggest that feedback interventions on, for example, diversification and common investor biases can help investors make better decisions for themselves. However, feedback on short-term performance or individual trades, for example, could encourage investors to take actions that undermine their investment goals.
Other Behavioural Techniques
The following sections describe and assess behavioural techniques that do not meet the definition of gamification. However, these techniques are informed by behavioural science and are being used by digital trading platforms in ways that influence investor behaviour.{71}
Salience / attention-inducing prompts
Definition: Information is more likely to influence people's behaviour if it attracts their attention. A very wide range of design features are included in this category, including visual cues as well as the specific language used in prompts. Often, the most attention-inducing language leverages other behavioural insights like social norms, loss aversion, and invoking scarcity. In this section, we focus specifically on the way platforms seek to direct user attention to some features and behaviours-and away from others.
General use and impact on behaviour: Strategies to increase the salience of certain information (or decrease the salience of other information) are ubiquitous across industries and used to influence an extraordinarily wide range of behaviours. Retailers, financial services companies, and public sector bodies alike use design choices like colour, images, personalization, the size, and placement of different information, and even humour to attract people's attention to specific information and options. These tactics can have positive effects, such as raising awareness of privacy notices on apps and websites.{72} They can also harm users by distracting them from other information, like additional costs,{73} and the proverbial "fine print." Push notifications are frequently used by app designers to boost engagement with the application, and prompts (e.g., pop-ups) are used to direct user attention to certain activities within the apps.
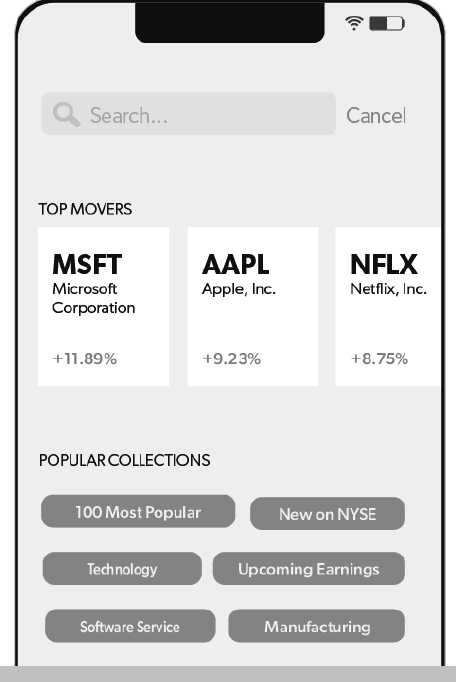
Figure 9: A modified version of Platform 7, which prominently features different lists on their home screen, including "100 Most Popular"
Current use on digital trading platforms and impact on behaviour: All trading apps make deliberate choices about what information is most salient to the user experience from signing up, to logging on, and to executing a trade. The way a choice is presented often influences what choice is made.{74} Given there is no truly "neutral" way to present options, the way information is displayed is necessarily influencing users' attention and action. Some design choices can be helpful, enabling users to find the most relevant features and understand key information more easily. In this section, we focus on more potentially concerning uses of attention-inducing prompts.
Many popular digital trading platforms prominently feature lists of stocks on their home screens, including "Top Movers," and "Most Popular" stocks. The salient placement of these lists has a dramatic impact. New entries into Platform 7's "Most Popular" list are five to seven times more likely to be purchased in the days following their listing.{75} The inclusion of a stock on Platform 7's "Top Mover" list is associated with it being traded 36 times more than the amount that it is traded on average, even when controlling for the overall market activity.{76} These attention-inducing lists are significantly associated with increased "herding"{77}, where retail investor choices are positively correlated with each other (they are making the same trades). Herding appears to result in significantly poorer returns for investors, with one study showing average 20-day abnormal returns of -4.7% for top stocks purchased each day.{78} In contrast, research conducted using transaction-level data from two German retail banks indicated that the prominent placement of "top movers" does not appear to affect returns.{79} The contrasting results could be a result of different platform interface designs, but it is also worth noting that the investors in this study were, on average, 45 years old with nine years of investing experience, which may suggest that these types of attention-inducing lists may have a more profound effect on younger, less experienced investors, who are the primary market for certain online trading platforms.
How information is displayed for individual stocks may also influence investor behaviour. Research examining investor-level brokerage data from China has found that increasing the salience of a stock's purchase price while keeping other information unchanged on the online trading screen increased investors' disposition effect{80} by 17%.{81}
Many popular trading apps also use push notifications to send out information to investors. For example, they allow users to create alerts for when stocks they're interested in hit a certain price or percentage increase or decrease of their choice. These types of attentional triggers can be useful for investors who need to monitor price movements as part of their investment strategy. Similar to other salience-inducing prompts like top traded lists, they can also influence investor behaviours in ways that are not aligned to the investor's strategy. The "lottery anomaly" refers to investors' preference for stocks with large potential gains, even when risks are proportionately higher. This anomaly is heightened when such stocks receive more investor attention, which might be the result of more analyst coverage or extremely positive recent returns.{82} Notifications are likely to play a similar role in heightening investor attention.
More broadly, push notifications on stock performance (e.g., "$ACME shares down over -5.2%") sent to investors' cell phones have been found to increase investors' risk-taking. One study showed that this type of attention-induced trade carried, on average, a 19-percentage-point higher leverage than other trades.{83} This impact was stronger for male, younger, and less experienced investors.
Potential use on digital trading platforms and impact on behaviour: Given the current widespread use of attention-inducing prompts on trading apps, it is likely that more platforms will continue to employ similar tactics. Prominent lists of trading options, like "Top Mover" and "Most Popular" lists may continue to cause "herding" and may also increase trading frequency. The widespread use of notifications and in-app prompts is also likely to expand, with many such messages leveraging other behavioural science techniques (e.g., invoking scarcity, loss aversion, etc.). Depending on the focus of these messages, they could increase trading frequency or shift traders into higher risk securities (e.g., options).
Attention-inducing prompts could also be deployed to support users in ways that are likely to support their long-term goals. For example, prompts could encourage users to engage in investor education, to increase deposits, or to explore options for diversifying their portfolios.
Simplification and selective deployment of friction costs
Definition: The design of the user experience that reduces or introduces small barriers across the user journey, influencing the likelihood and manner in which a user completes a specific task. We use "simplification" to refer to reductions in small barriers and "friction costs" to refer to increases in small barriers.
General use and impact on behaviour: The small details that make a task appear more challenging or effortful have a large impact on the likelihood of a person completing that task. In fact, the large effect they have on whether someone completes the task is disproportionate to the size of the detail. For example, simplifying the process of applying for college financial support by pre-populating the application with known information resulted in students being more likely to attend university by 8 percentage points.{84} Even something as minor as reducing the number of 'clicks' it takes to access a tax form by linking the form directly instead of linking to a website that includes the form has been shown to increase tax collection rates by 4%.{85} Amazon has been a trailblazer in leveraging simplification in online retail, implementing a "1-click" buying option to encourage impulse buying. In terms of mobile apps, the perceived ease of use of an app significantly impacts one's intention to use the app among young adults.{86} Ease of use may also contribute to the perception of enjoyment of gamified e-banking apps.{87}
However, while simplifying user experiences and reducing points of friction generally have positive effects, it can also make undesirable behaviours too easy to follow through on. In these instances, adding friction can help people slow down and think more deeply about their actions rather than relying on their gut instincts. For example, in a large online survey experiment, creating a moment for reflection by asking participants to explain how they knew that a political headline was true or false decreased their intention to share false news headlines.{88}
Current use on digital trading platforms and impact on behaviour: Many trading apps, including Platform 7, 8, 10, and others boast quite seamless user experiences, making it as easy as possible to register for an account and begin placing trades.
1. They make it easy to sign up for a trading account by keeping the sign-up process short and guiding the user through the process. This is likely to increase market participation and save investors time.
2. The platforms also make it easy to deposit and access funds. For example, Platform 10 prompts users to set up automatic deposits into their account when adding funds. They also offer 'premium features' for a small monthly fee ($3), allowing users to "add up to $1,000 in seconds with no holds", enabling more immediate trading. While there are certainly positive elements to this, it may also increase "hot state" (non-deliberative) trading by making it easier to make spur of the moment trades.
3. The platforms tend to present users with less data for researching investment options. Besides basic market information, Platform 7 only provides investors with five charting indicators,{89} while another US-based trading platform provides 489.{90} It is unclear what impact, if any, this form of simplification has. On one hand, it may reduce choice overload and increase investor focus on the most relevant information. On the other hand, it may reduce the time investors spend researching and deliberating or make pertinent information harder to find and therefore less likely to be used in trading decisions. Our literature scan did not identify any empirical evidence on the average impact of reducing the number of indicators. From a theoretical perspective, it is important to balance the need for providing investors with the data required to make informed investing decisions (e.g., deciding between similar investment funds, for example) and avoiding information overload.
4. These platforms also appear to require fewer "clicks" to execute trades, although we did not find unequivocal data to confirm this. While a streamlined process can save users time, it may also provide fewer opportunities to rethink their trades and increase speculative trading, leading to lower investment returns.{91} This is particularly relevant when considering the full package of social interactions, attention-inducing prompts, and other behavioural science-informed tactics present on these platforms. For example, a social interaction may trigger an inclination to make a trade that is not aligned with the investor's overall strategy, and then a seamless, quick trading interface would increase their propensity to follow through.
5. Platform 7 has received scrutiny for making it easier to trade more complex, high-risk securities like options by simply checking a box during the account sign-up, without providing explanation of these types of assets or warnings of the increased risk and complexity.{92} While we do not have evidence on the impact of this, it could be problematic in encouraging investors to make trades that do not align with their investment strategy and risk tolerances due to a lack of understanding. Platform 7 has now tightened eligibility for users to engage in options trading, requiring users to have a certain level of experience. Our environmental scan did not determine the approach that other platforms are taking to higher risk activities like margin or options trading, as we did not attempt to execute any trades on the accounts we set up.
Potential use on digital trading platforms and impact on behaviour: It is likely that digital trading platforms will continue to search for opportunities to reduce frictions across the user experience. In some areas, it is likely that these platforms have already streamlined the experience as much as possible within the limits set by Canadian regulation that govern Order Execution Only activities.{93}
Members of the U.S. Securities and Exchange Commission (SEC) Investor Advisory Committee have advocated for the inclusion of frictions into the trading process to promote a deliberative mindset.{94} Suggested frictions include building in delays, creating decision points, and using nudges that encourage users to slow down and reflect on the longer-term outcomes of their investment decisions by envisioning the effect of the decision in the future. Balancing the ease of use and friction, as well as selection of where and when friction is required, can help protect investors.
Social interactions
Definition: Design elements that enable platform users to interact with other users by i) generating, sharing, viewing, and reacting to content, and ii) engaging in direct messaging. Note that we exclude referrals from this section as they represent a very low level of social engagement and are not the focus of the social interaction literature. We also exclude social-media style "posts" or "feeds" that come from individuals who self-identify as financial / investing experts.
General use and impact on behaviour: Techniques designed to facilitate social exchange and feedback-such as 'likes' on Facebook, Instagram, and Twitter-are central elements of the social media experience. They are also increasingly used by other applications, such as fitness apps, to stimulate greater levels of engagement. For example, Peloton has introduced new social features like hashtags to enable users to connect with peers with similar goals and interests.
Brain scan studies indicate that virtual social feedback might contribute to the addictive nature of social media platforms, as it engages brain regions that are at the core of our ability to process rewards, acquire habits, and become addicted.{95},{96} While such an internal reward mechanism plausibly evolved to reinforce (and ensure repeats) of beneficial social interactions, there is a growing recognition that it can generate a problematic level of attachment to the social media experience. To our knowledge, effect sizes associated with social features have not been reported.{97}
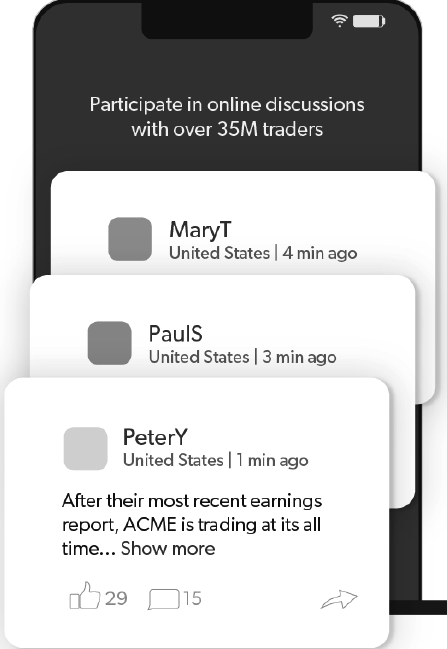
Figure 10: A modified version of Platform 2, which hosts a social news feed consisting of content posted by users
Current use on digital trading platforms and impact on behaviour: Social interactions are present across a range of online digital trading platforms. Users of a US-based trading platform have the option to publicly display their portfolios and share their investment decisions with other users. Platform 11 features a similar mix of social interaction features: users have access to a social news feed consisting of content posted by their peers, the opportunity to chime into conversations highlighted under 'Most popular topics' hashtags, and the chance to follow and copy others' investment decisions. These functions are also replicated on Platform 2. Platform 8 also had the option to enable 'Social Investing', where users can discover and follow other members' investment holdings, watchlists, and investment activity, and have the ability to comment on and react via emoji to other members' activity. This feature has been disabled, although it is unclear why.{98} At least one platform currently in development will go even further, fully "enabling dialogue and community engagement between users."{99}
Social interaction features are leveraged by Platform 5, which has integrated a Twitter-like social media platform for the financial community, into their mobile platform, enabling users to follow investing ideas and discussions from other investors.
Social interactivity has a demonstrated impact on engagement with digital applications. This in itself may be problematic, as investors who check the status of their investments more often trade more and have worse performance.{100} Sociality might also contribute to problematic levels of engagement in other ways. If users' trades can be "liked", recommended, or otherwise promoted, their desire for social recognition and status could lead to increased trading frequency in the same way people post more on Facebook to get social affirmation. Social interactions are also likely to increase the disposition effect, with users holding onto losing investments for longer periods of time or not sharing information about losing trades to "save face".{101} The increase in disposition effect is more likely to occur in stock trades than (actively managed) fund trades, as traders can assign blame for poor performance to fund managers in the latter case.{102}
In terms of the quality of investment, the evidence is equivocal about whether making decisions under social influence is inherently bad for financial outcomes. One recent analysis of over 28 million trades on an unspecified online trading platform with social features revealed several insights that are useful for a broad risk assessment. First, investment decisions made as a form of social mirroring represent the majority (67.6%) of decisions compared to those that could be classified as independent. This implies that, when digital trading platforms make social influence features available, users' behaviours are likely significantly affected. Secondly, the study revealed a complex picture when it comes to assessing whether social trades make for poor decisions. Social mirroring, where a user copies the decisions of one or more selected traders, produced more "wins" (a trade with a net positive return) compared to independently chosen trades (84% vs 59%). However, these wins resulting from mirroring had statistically significantly lower ROIs (0.177% vs 0.183%), while ROIs on losses were also significantly more negative (-0.9% vs -0.38%).{103} Thus, while social mirroring may produce more "wins," it may also lead to lower levels of positive ROIs and higher levels of negative ROIs. Despite the evidence that social influence can have benign effects on investor outcomes, it is difficult to ignore prior events which point to a dramatic impact of mass social mirroring phenomena. This is clearly demonstrated in the 2021 "meme stock" phenomenon driven by Reddit's "wallstreetbets" forum.
Social features might interact with other gamification elements in a way that increases user risk. For instance, while it's unclear whether peer-to-peer sharing of investment decisions (which is already available on apps such as Platform 11) produces negative investment outcomes, there would likely be significant cause for concern where sharing functionalities are coupled with leaderboards (see Leaderboards) or badges (see Non-economic rewards). These two techniques have the potential to nudge users towards making decisions in a competitive mode rather than based on their individual investing goals and context, which could be heightened by embedding social interaction features.
Investors already have many options for social interactions related to investing, including prominent message boards like Reddit. However, embedding social interactions within the digital trading platform makes it much easier to act on the basis of that interaction without pause for consideration.
Potential use on digital trading platforms and impact on behaviour: We believe that most potential social interaction features are discussed in the previous sub-section, although we certainly cannot rule out further developments. For example, many digital platforms enable their users to engage in social interactions using avatars-digital personas that serve as idealized visual representations of the users. While avatars are considered a classic gamification technique and are used across a range of contexts (e.g., self-help health apps{104},{105}, virtual meeting platforms{106}), we did not identify any instances of them being used by investing platforms. Avatars could be used to promote and encourage the forms of social interaction described above. Platforms could also create team-based competitions, as such competitions create more engagement and referrals.{107}
Social norms
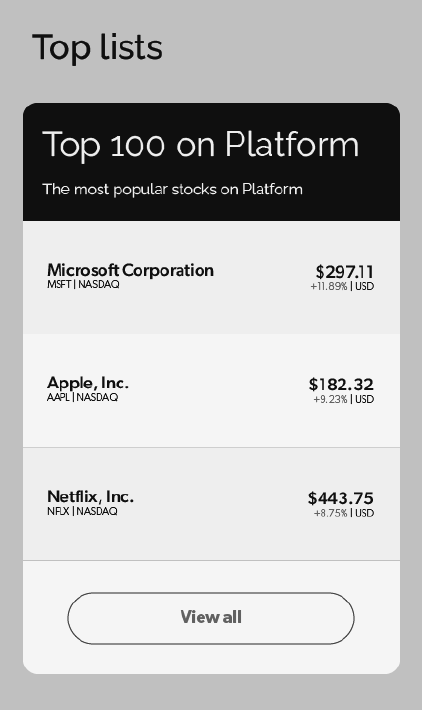
Figure 11: A modified version of Platform 10, which has several lists showing which stocks other users are trading and holding in high volumes
Definition: Design features which signal social norms-i.e., information about how others think and behave. This might involve explicitly informing individuals about statistics pertaining to relevant group behaviours (e.g., "88% of your fellow users have invested in green energy this year") or implicitly signalling "crowd approval" through features such as "This week's 100 most popular stocks" and "Today's trending industries."
General use and impact on behaviour: As social animals, we are influenced by norms-that is, how we perceive others to think and behave (or how we perceive their expectations of our own thoughts and actions). When a particular norm is not known to us, or when we have little knowledge of the best course of action in a specific situation, being informed of what others are doing either implicitly or explicitly can influence our behaviour. The impact of learning about a norm is higher when that norm is surprising and the group whose behaviour and/or preferences we are being informed of feels relevant to us.
Social norm interventions are a common feature of behaviour change programs in a variety of domains. Communications about descriptive social norms, which inform people about the behaviours of others, have been found to reduce the use of plastic bags{108}and increase energy conservation{109}, recycling{110}, and timely tax filing{111}. Retailers frequently invoke social norms to increase product sales (e.g., "Over X million satisfied customers!"). While less common, researchers and some organizations are starting to test the impact of dynamic social norms, communicating norms in terms of change rather than absolute levels of behaviour (e.g., "78% more Canadians are doing X each year" versus "78% of Canadians are doing X").{112}
Current use on digital trading platforms and impact on behaviour: Social norms are commonly leveraged on digital trading platforms. Platform 7 displays a daily 'Top 100 stocks' list on its homepage, which sends an implicit signal about the stocks that are receiving most attention, and thus represent a "normal" position. Platform 11 presents users with a list of 'Most popular topics', capturing the most-discussed industries and investments of the day. Similar tactics are used by platforms with a presence in the Canadian market. Platform 10 features dynamic social norms through elements such as 'Top 100 on Platform' and a 'Top 100 Canadian/US Stocks' list based on the most actively traded stocks on the Canadian/US exchanges on any given day. Such lists tend to have a small sub-heading briefly explaining the list to amplify the lists' appeal (e.g., "The most popular stocks on Platform 10"). These features have concrete implications for how retail investors make decisions. As noted above, Platform 7's daily 'Top 100 stocks' list promotes "herding," whereby disproportionately large numbers of retail investors buy or sell particular stocks at the same time.{113} In turn, herding appears to decrease investment returns, on average. It is unclear how much of this effect is driven by the salience of the information compared to the fact that it represents a social norm that might be loosely summarized as: 'if everyone else is doing / saying it, it must be right'.{114} We imagine that both factors contribute to the effects observed.
Potential use on digital trading platforms and impact on behaviour: We anticipate that the types of lists of commonly traded securities noted above will remain the most common form of social norm intervention deployed on digital trading platforms. More specific and personalized social norm prompts could certainly be pushed to users (e.g., "80% of investors like you are buying ACME"), although such prompts may not be permitted on self-directed digital trading platforms under IIROC rules. Were they implemented, we believe that these explicit prompts would be just as, if not more, impactful than the lists of top traded stocks.
Summary
The preceding taxonomy outlined five gamification techniques and four other behavioural techniques relevant to retail investing on digital trading platforms. For each technique, we provided a definition, outlined how the technique is used in general, how it is used on digital trading platforms today, and how it might be deployed on those platforms in the future. We also explored the positive and negative impacts these techniques may have on various retail investor behaviours. It is challenging to assess the relative impact that each of these techniques may have on investor outcomes given the novelty of these approaches and corresponding gaps in empirical research. However, based on current evidence and theory, we believe that social interactions, rewards, and gamblification techniques are likely to have the largest impact on behaviour.
Experimental Research Methodology
We conducted a randomized controlled trial (RCT) to assess the impact of two behavioural techniques on investing behaviours: (1) giving investors points with a very low value for buying or selling stocks (rewards) and (2) showing investors a "top traded list" (social norms and attention-inducing prompts). There were no fees for trading in any of the conditions. Our primary interest was in whether these techniques increased trading frequency relative to a control group not exposed to points nor to a top traded list. We also explored outcomes related to diversification of holdings, disposition effects, and, for the top traded list, stock selection.
RCTs examine the causal relationship between a condition and outcomes by eliminating the effect of potentially correlated external factors. What sets RCTs apart from other methods is that participants are randomly assigned to experiment groups, as defined below. With a sufficiently large sample, random assignment ensures that-on average-individuals across groups only differ in terms of their group assignment. By eliminating differences across groups, we ensure that any difference in outcomes can be attributed to group conditions, as opposed to other confounding factors.
Condition |
Description |
|
|
Control (n=803) |
Participants in the Control condition traded six fictitiously-named stocks (based on real stocks) over seven simulated weeks of investing on a platform that did not include any behavioural techniques. |
|
|
Points (n=811) |
Participants in the points condition traded simulated stocks on a platform that included point rewards, which were prominently displayed. Participants received 100 points each time they bought or sold a stock, and every 1,200 points were worth $0.01 in additional compensation. As a result, the maximum value of these points was only about $0.08 if they traded every stock every week, a negligible but non-zero economic value. |
|
|
Top Traded List (n=816) |
Participants in the top traded list condition traded stocks on a platform that included a top traded list showing three stocks labelled as most actively traded on the investing simulation platform each week. The top traded list rotated each week based on the historical data on trading volumes for selected stocks, as described further below. |
The experiment was conducted online in a simulated trading environment using Predictiv, BIT's proprietary platform for online experimentation. Our sample included 2,430 Canadian residents from all provinces aged 18-65 years engaging with the experiment on mobile (55%), tablet (4%), or desktop (41%) devices. Over 50% of our sample were investors.{115} Our sample was well balanced on gender (50% female) and age (median age: 35-44). Additional demographic details are available in Appendix B (Detailed Experimental Research Findings).
Research participants received $10,000 in simulated "money" to invest in up to six different fictitiously-named stocks. After their initial allocation of funds, they were taken through seven simulated weeks of stock price movements, with an option to buy and/or sell stocks between each week. At the end of the experiment all participants received a fixed amount of approximately $1.00 for participating in the experiment. They also earned up to $1.70 additional compensation based on their balance at the end of the experiment.{116} Participants were aware that the larger the portfolio at the end of the experiment, the more they would earn. This created an incentive for participants to trade thoughtfully and to try to maximize their returns.
The following graphic provides a more detailed overview of the steps participants went through to buy and sell stocks on the simulated stock market. All participants went through the same steps regardless of which trial condition they were randomly assigned to.
Figure 12: Overview of research experiment
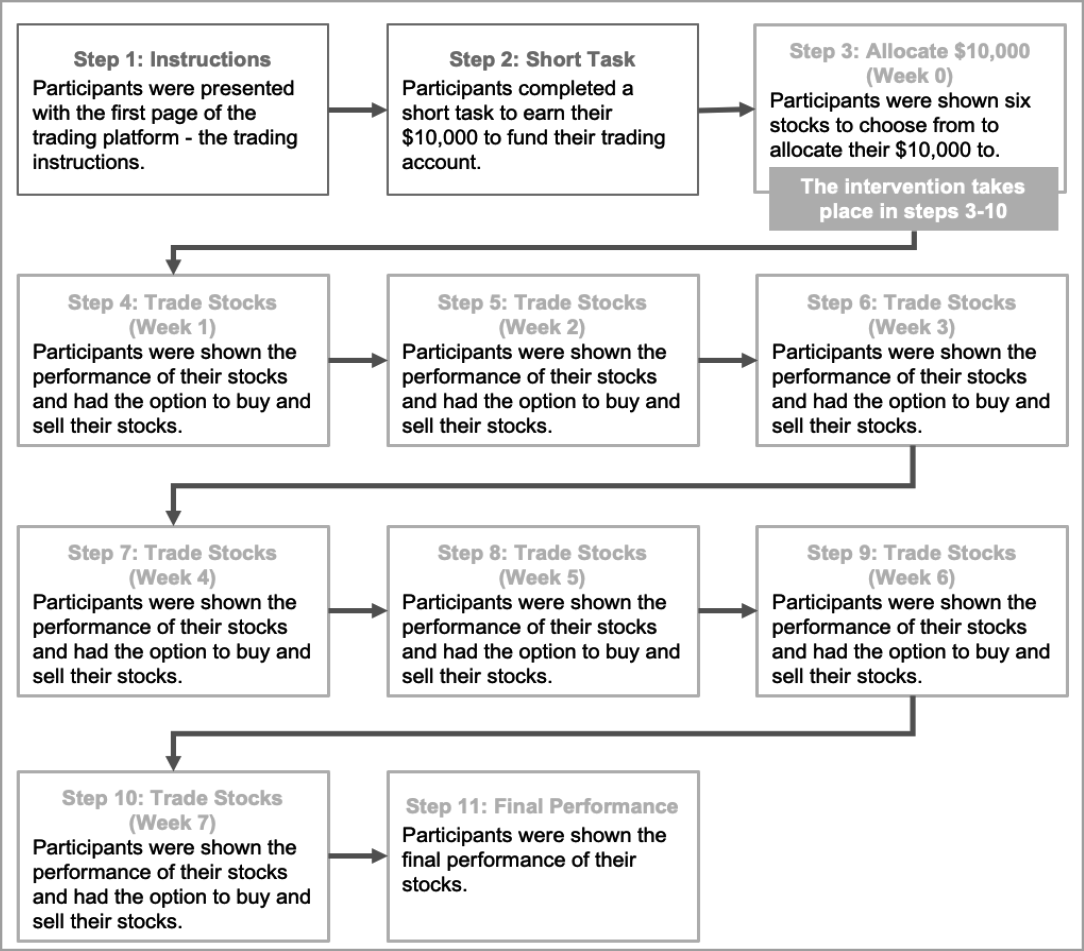
Price movements for the fictitiously-named stocks used in our simulation were based on real stocks. To do so, we randomly selected stocks that met the following criteria: (1) listed on the Nasdaq exchange website, (2) within the technology sector, (3) with a micro ($50M-$300M) or nano (<$50M) market capitalization, and (4) an opening price below $4 per share. For the selected stocks, we used historical opening price data for eight consecutive Mondays in 2021 to determine the opening prices for each of the weeks of the experiment. The purpose was to create stocks with a similar risk profile and a medium-high level of volatility. Participants were informed at the onset of the simulation that all stock price movements were based on real, historical data.
Our experiment was designed to maximize its generalizability to real-world trading. Beyond the use of variable compensation and modelling stocks on randomly selected real equities, our RCT methodology enabled us to isolate the effects of the behavioural techniques we examined, controlling for potentially confounding factors. Overall, the trial implementation was successful:
• Recruitment was effective and the study was well-powered, with more than 800 participants in each condition.
• There were no differences in attrition across groups.
• Participants engaged meaningfully with the trading simulation, with a median completion time above 12 minutes.
Notwithstanding the quality of the research design and execution, the nature of the study as a trading simulation is an important limitation. It is likely that some aspect of participant behaviour would be different in a real-world setting. For example, participants may be less risk averse in a simulated environment than they would be if their own savings were on the line. Further, the compression of trading activity into a single session cannot replicate the effects of time on investor decision-making. Real-world events like the explosion of interest in GameStop in early 2021 could prompt shifts in how behavioural techniques influence trading behaviours.
Figure 13: Selected experiment screenshots
Control condition
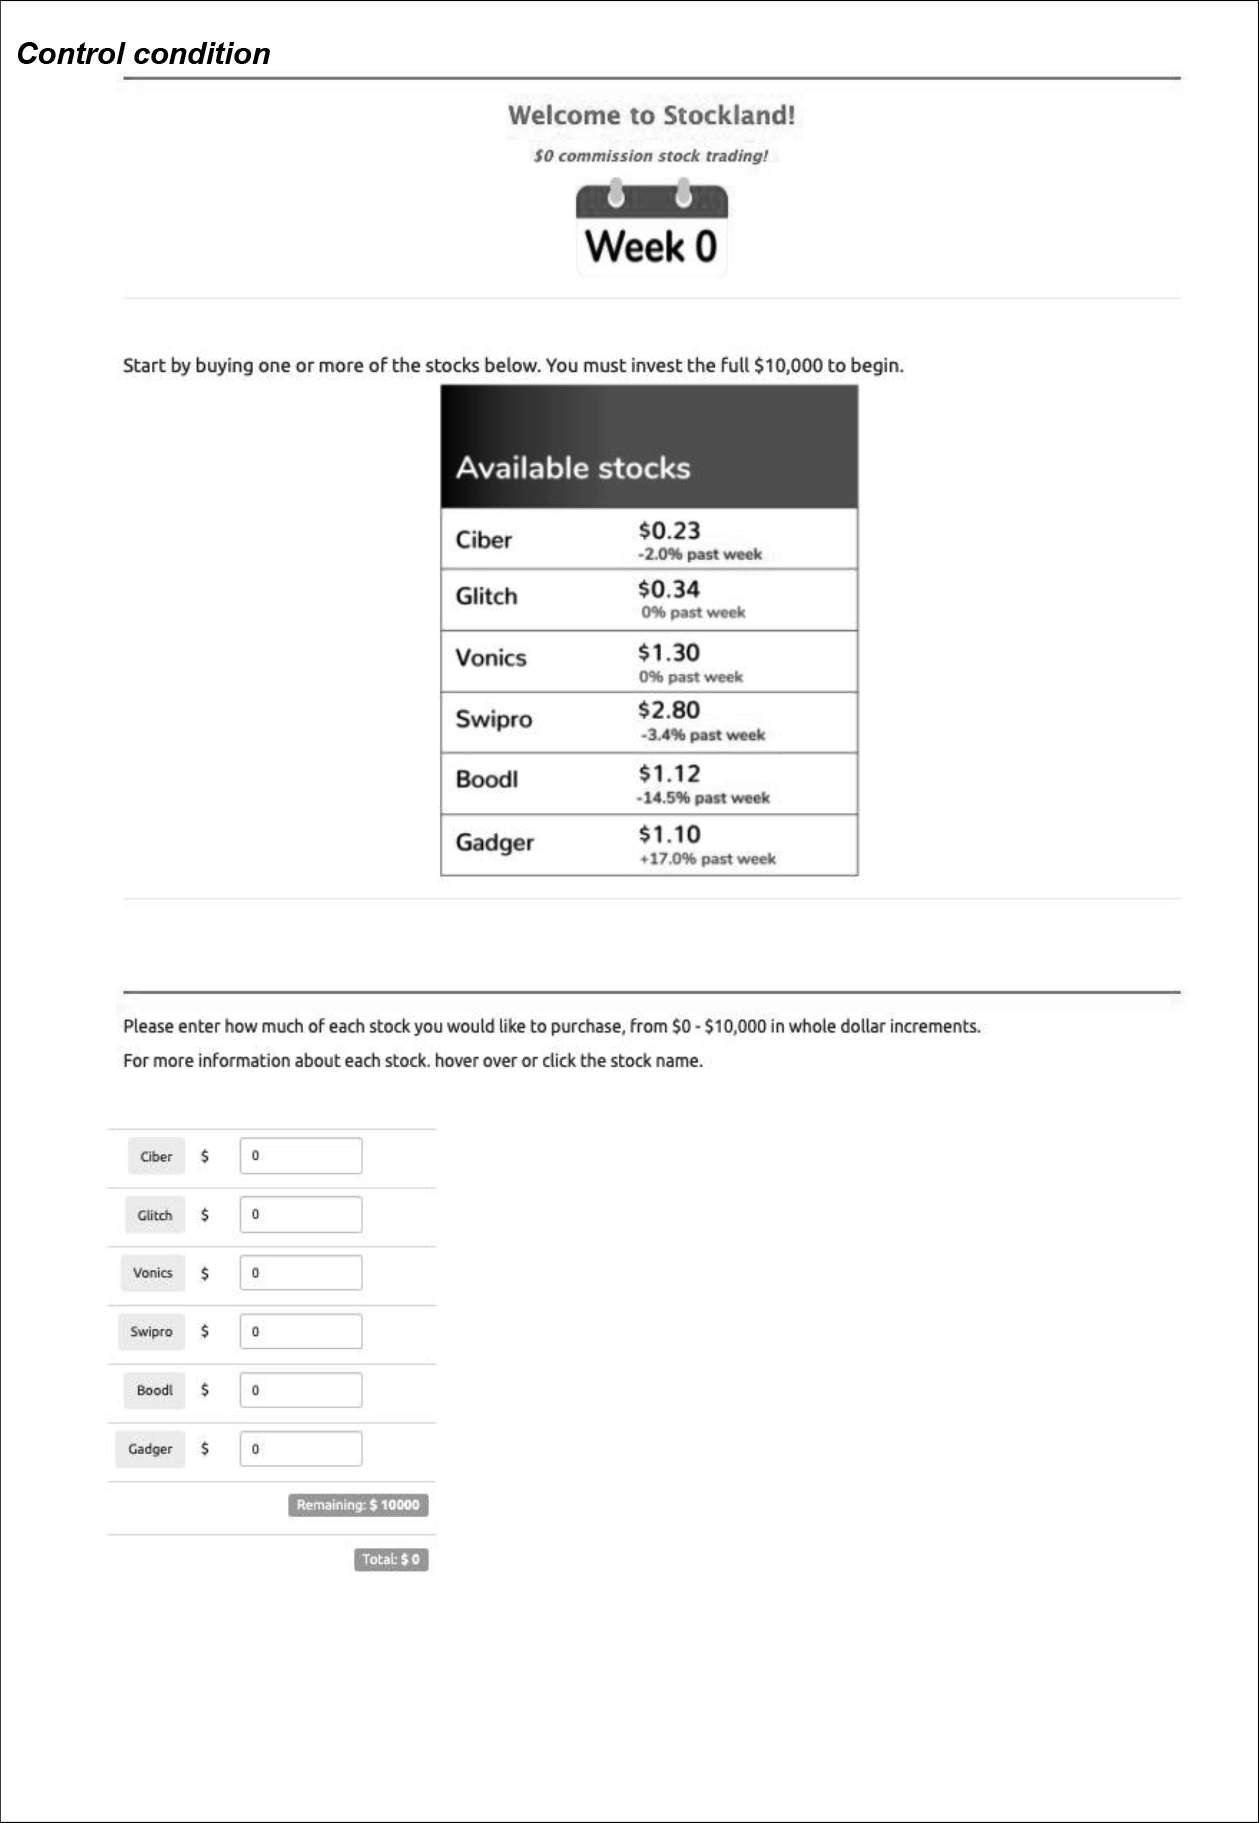
Points condition


Top Traded List condition
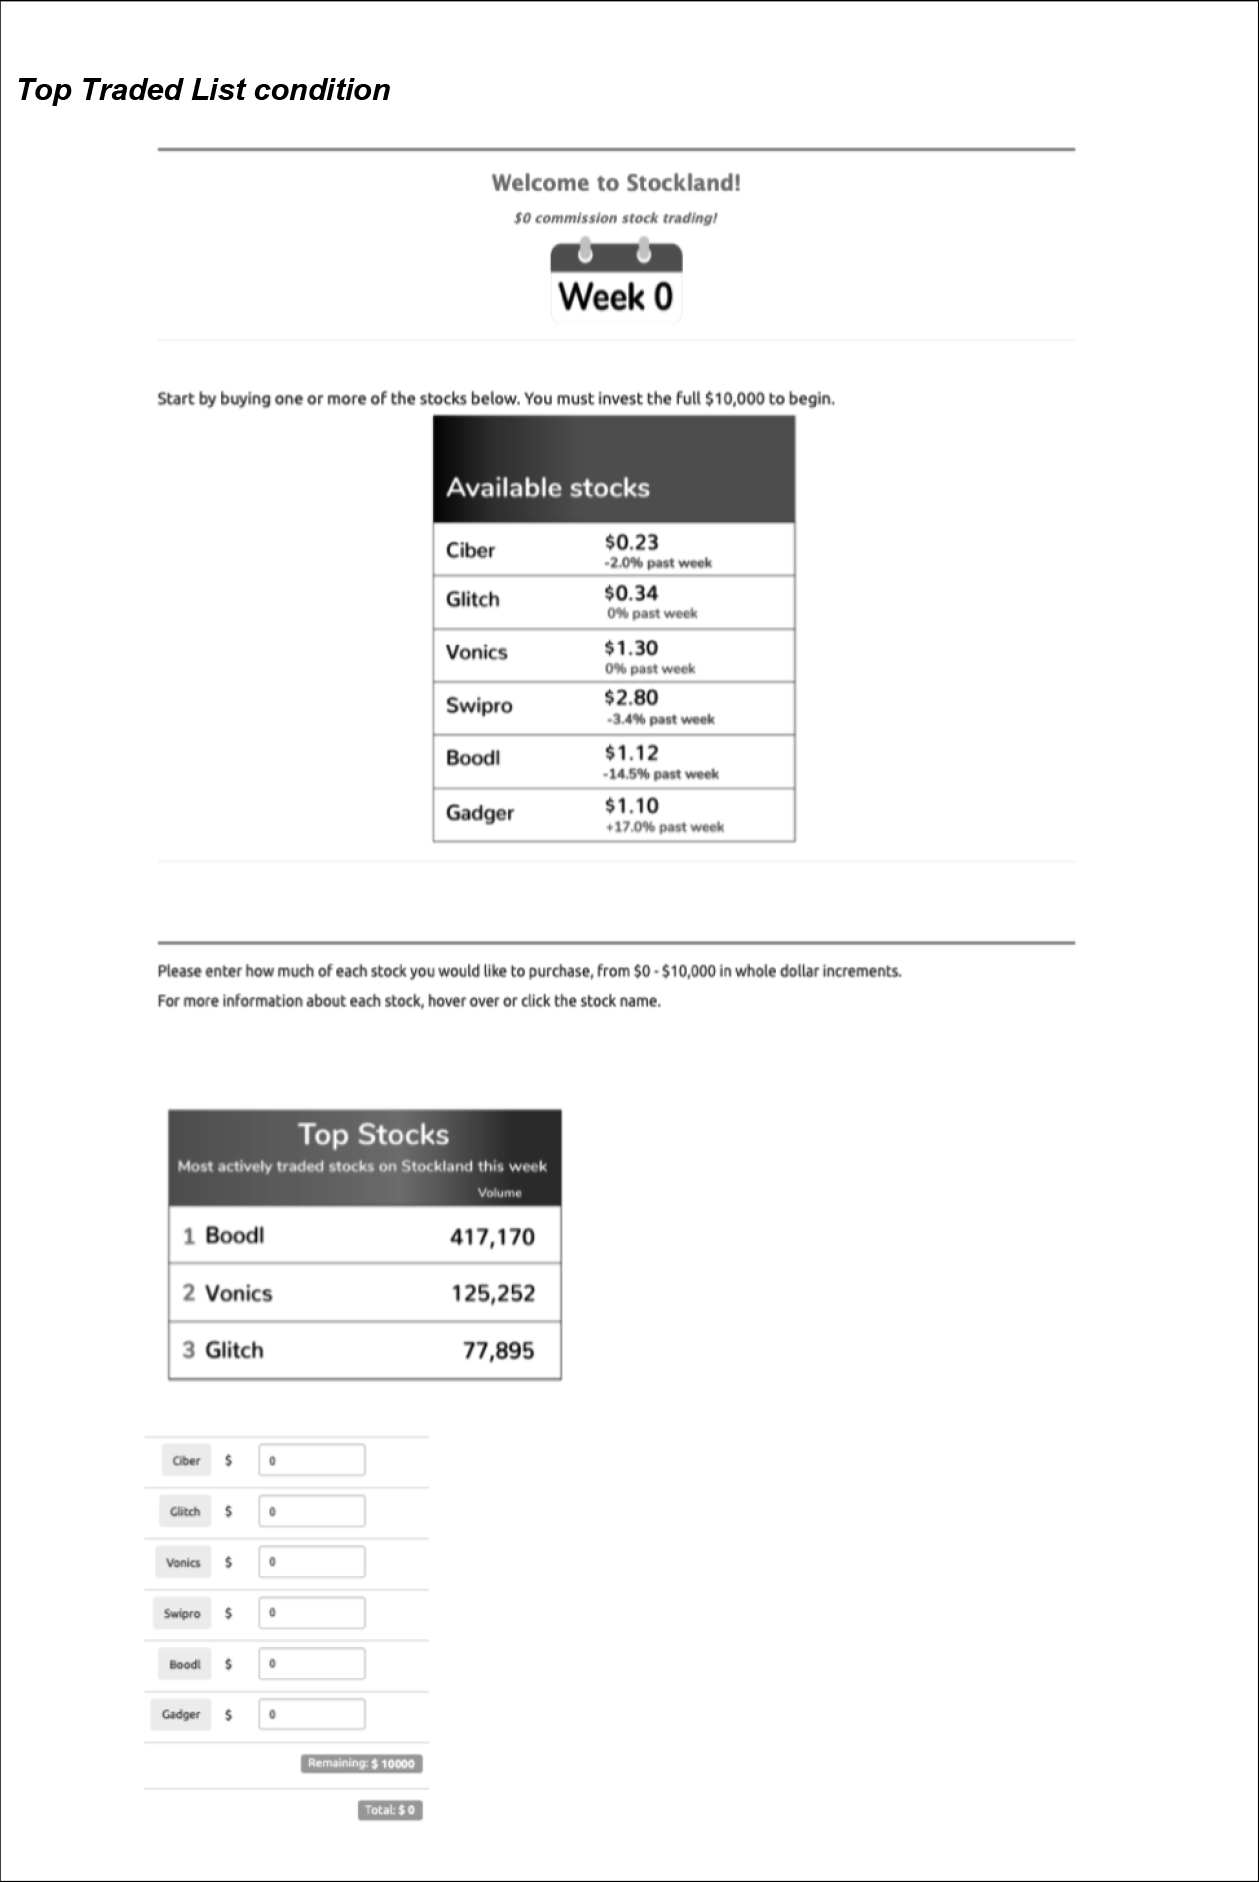
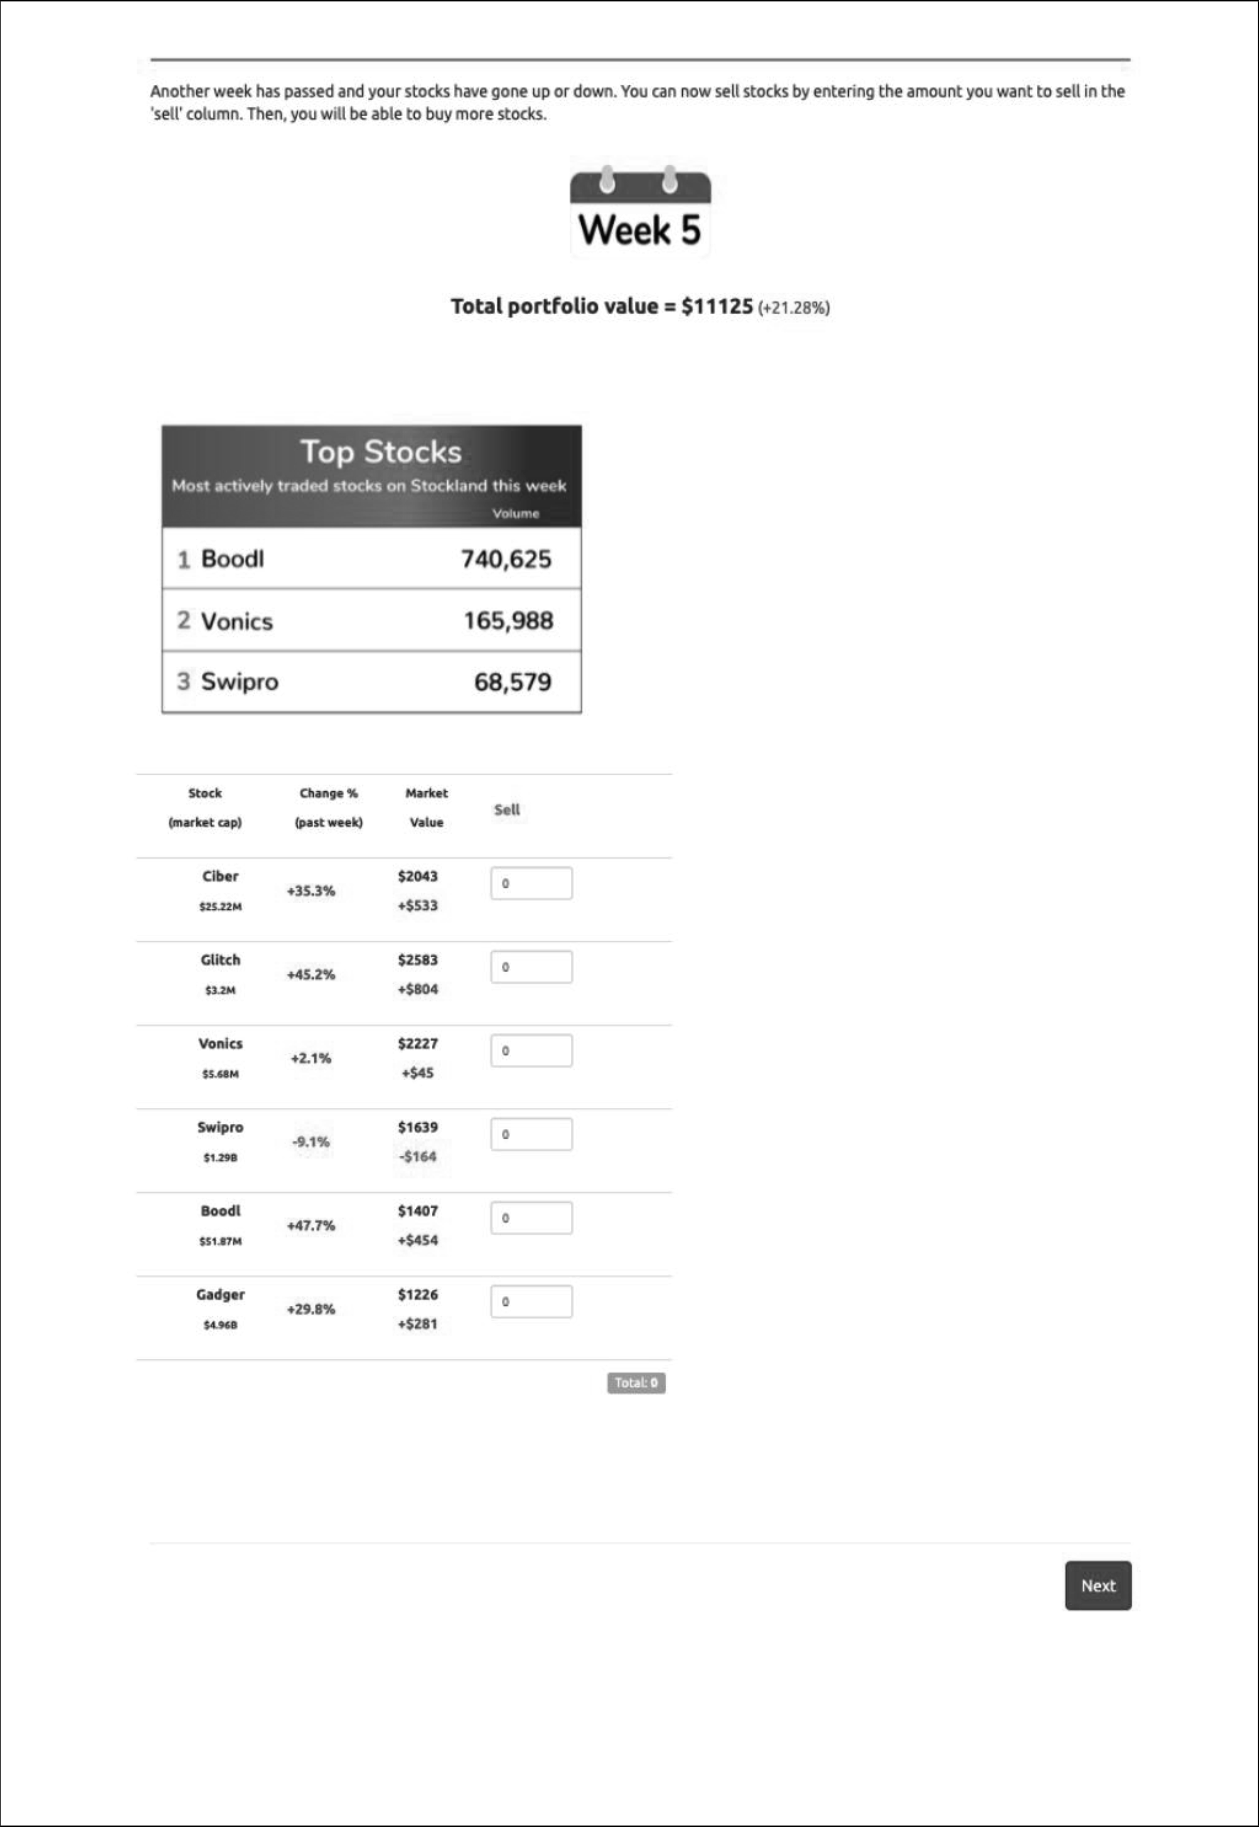
Primary Results: Trading Frequency
Our primary outcome of interest was trading frequency, given the potential incentive for digital trading platforms to encourage more trading and the negative impact of higher trading frequency on investor returns. We measured trading frequency as the number of times participants either buy or sell a stock over the course of the trading simulation.
As shown on Figure 14 below, participants in the points group made 39% more trades than the control group, a statistically significant difference.{117} Showing research participants a top traded list did not increase their trading frequency.
Figure 14: Trading frequency by experiment group
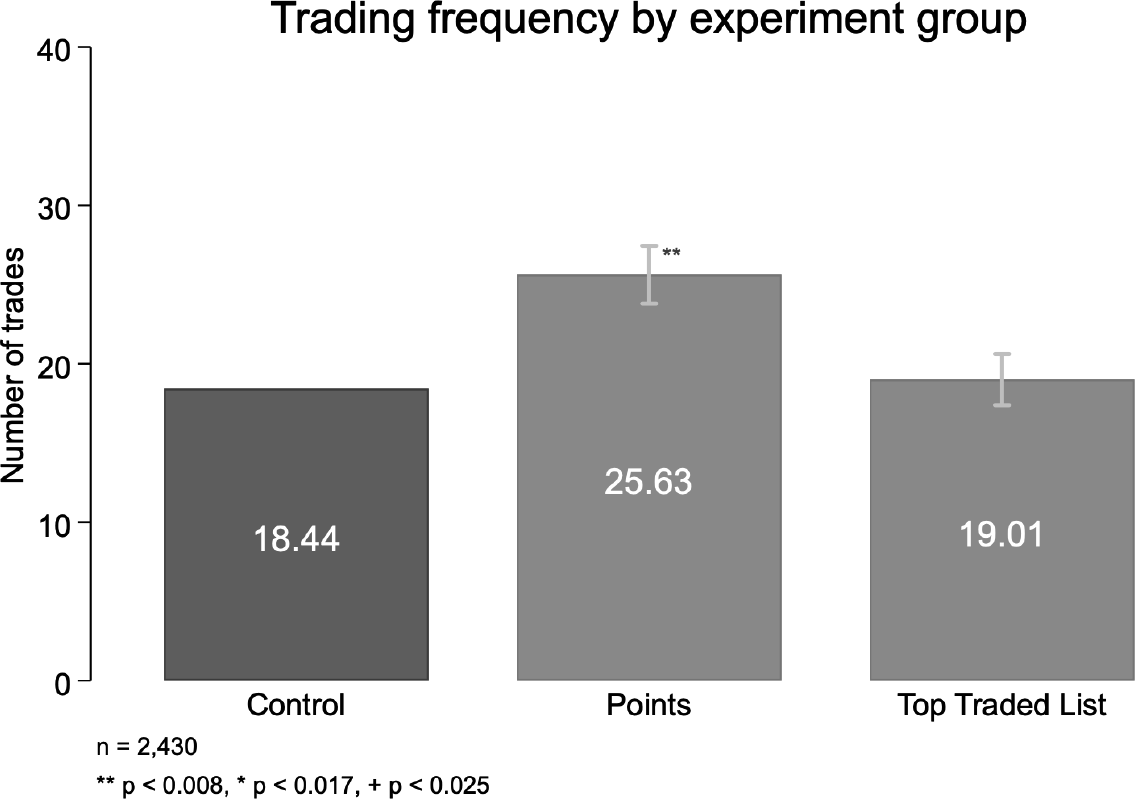
Primary analysis, controlling for age, gender, education, income, objective investing knowledge, and risk preference.{118}
These findings suggest that reward-based gamification tactics can meaningfully influence investor behaviours by encouraging greater frequency of trading. This can occur even when rewards have a negligible economic value for investing, as in our simulation. This finding is important because more frequent trading has been shown to yield poorer investment outcomes for retail investors, especially among those with less investment knowledge or experience.{119}
Secondary Results: Diversification
Our secondary outcome of interest was participants' diversification, defined as the extent to which investors diversify their money across the six different stocks investors could buy and sell throughout the experiment.{120} Diversification is a critical risk mitigation strategy for investors.
There were no differences across experiment groups on participants' diversification. On average, participants' diversification scores across groups ranged from 0.69 to 0.71 on a 0-1 index, where 1 represents an equal allocation of funds across all investment options. These findings suggest that exposure to these two techniques is not associated with significantly less diverse investment portfolios. We had hypothesized that the top traded list may reduce diversification by concentrating trading in the listed stocks. While we did not observe that in our trial, diversification outcomes may be influenced by other factors, such as the limited number of available stocks and their characteristics as well as the limited number of 'weeks' of trading, that we could not fully model in our experiment.
Exploratory Results
The experiment provided rich data on a wide range of other investor behaviours and choices. This section summarizes the additional analysis that we did using this additional data that went beyond what was required to answer our core research questions.
Impact of top traded list on stock selection
Participants in the top traded list group bought and sold more of the stocks on that list than participants in the other groups. As shown in Figure 15 below,{121} 44% of the total value of the stocks bought or sold in a given week in the control group (and points group) were from the top traded list, but that value was 50% in the top traded list group. This is a 14% relative increase. This effect was somewhat stronger for buying stocks than it was for selling stocks, and as a result we see participants holding more of the top traded list stocks in the top traded group than in the control group.{122}
These findings reinforce analysis conducted by Barber et al. (2020) showing that a salient list of stocks frequently traded by other investors shifts trading activity toward those stocks.{123} That study also shows that this negatively influences investor returns.
Figure 15: Amount of top traded stocks bought and sold as a percentage of total amount traded.
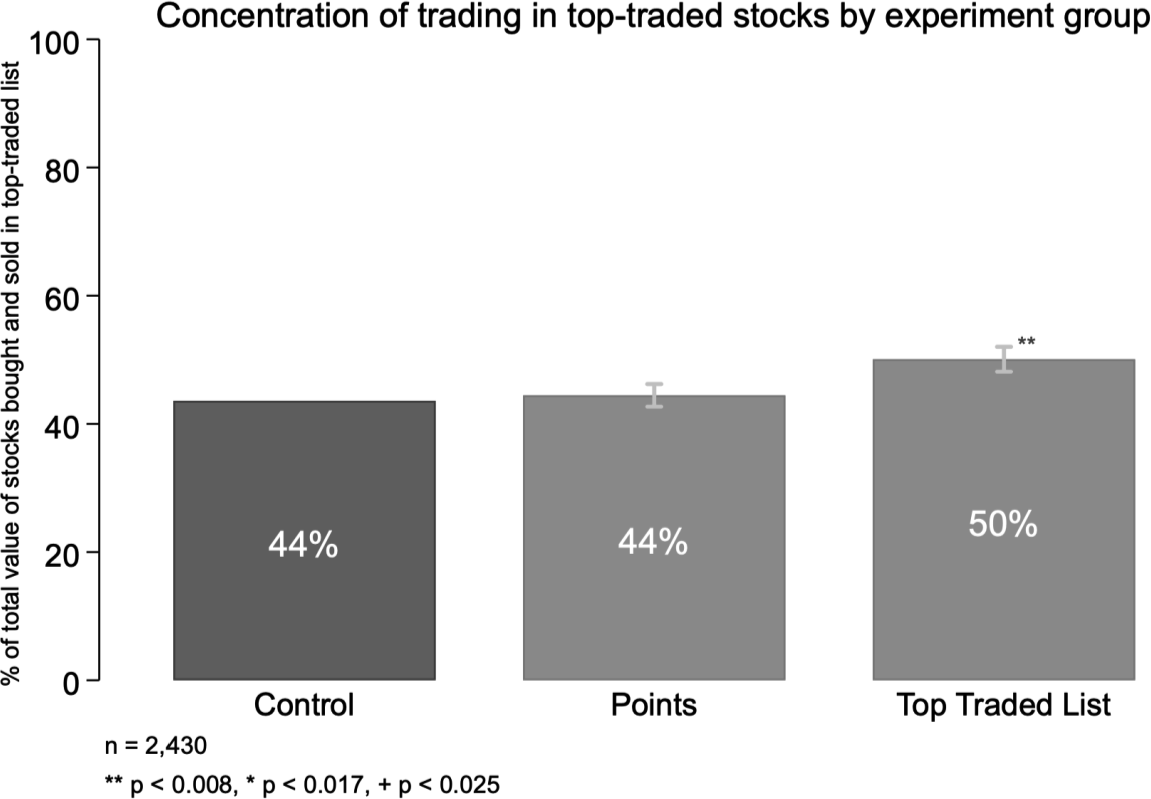
Exploratory analysis, controlling for age, gender, education, income, objective investing knowledge, and risk preference.
Final fund values
There is a robust evidence base linking increased trading volume to lower retail investor returns over time.{124} This can be attributed to the timing of retail investor trades relative to other (e.g., institutional) traders, as well as transaction fees and other costs related to trading. In our experiment, there were no transaction fees or other related charges, which would have decreased final fund values for participants with greater trading frequency. Other aspects of our experimental design -- including the single-session limit on decision time horizons, number of stocks available, and stock types -- are different from real-world trading. Given these factors, we did not hypothesise that either gamification conditions would impact participants' final fund balance at the end of the trading session. Indeed, we find statistically similar balances at the end of the session across all three groups.{125}
Disposition effect analysis
The disposition effect refers to the tendency of investors to sell assets that have increased in value while keeping assets that have dropped in value. This tendency can negatively impact investor returns, and we wanted to measure whether either of the behavioural techniques had an impact on the disposition effect.
To measure the disposition effect, we created a variable for each stock, at each experiment screen (i.e., week), indicating if price increased or decreased. We then assessed the effect of price increase or decrease on participants' likelihood of purchasing or selling the stock. We found that, on average, there was not a disposition effect observed in any of the groups, and there were no differences in disposition effect across groups.{126} The lack of disposition effect, which is present in most investing contexts, was driven by investors in our experiment holding onto winning investments at a high rate. We hypothesize that this is driven by lower risk aversion by our research participants than real-world investors.
We also assessed the extent to which disposition effects impact trading frequency.{127} We found a statistically significant correlation. This suggests thatpeople who exhibit a greater disposition effect are also more likely to make more trades. A 10% increase in participants' disposition effect index was associated with approximately one additional trade being made. The positive correlation between participants' disposition effects and trading frequency suggests that a higher disposition effect may increase trading frequency as individuals make a greater number of buy and sell decisions in response to market price fluctuations. Alternatively or additionally, there may be one or more factors that affect both outcomes. For example, individuals who are more prone to the disposition effect are more likely to be making trades based on intuitive, rather than deliberative, decision-making processes, which in turn may yield greater trading frequency.
A wave of digital, mobile-friendly self-directed investing platforms has created new options for retail investors in Canada and around the world. While these platforms have expanded market participation, there is growing concern over some of the digital engagement practices used by them and (to a lesser extent) by more traditional retail investment platforms.
The goal of this research is to support the Ontario Securities Commission (OSC) and other regulators and stakeholders in understanding and responding to these new developments: to help chart an effective, evidence-informed path forward as digital trading platforms continue to evolve and grow.
Across the research activities, we found significant gaps in the empirical literature; very few studies have examined the impact of these techniques on various investor behaviours. There are notable exceptions. For example, there is good evidence that top traded lists can induce "herding" behaviour by concentrating investor attention on salient stocks,{128} and that an assortment of gamification tactics used in a simulated trading environment can increase investor risk-taking.{129}
Our research on behalf of the OSC adds another critical finding, that offering rewards (points) with negligible economic value may dramatically increase trading frequency. Based on this finding, we recommend that regulators consider whether to limit digital trading platforms from offering points or other rewards for trading activity. We also believe that regulators should consider collecting more data on how top traded lists (whether it be most actively traded, top movers or otherwise) influence retail investor behaviour including investor allocations to those stocks on the "top lists".
While our research program produced insightful findings of the effects of points and top traded lists on trading frequency, we should be cognizant of the effects of other gamification behavioural techniques on investor behaviours. Thus, we further recommend that the OSC and other regulators gather more data, especially for other techniques (e.g., gamblification, feedback, social interactions, etc.). To do so, we recommend more studies be conducted on simulated investing platforms, akin to our work as well as that of Chapkovski et al.{130} Regulators should also seek to leverage data collected by digital trading platforms. This could include data from A/B tests of new digital engagement practices (DEPs). If DEPs have not been A/B tested, historical data on key investor outcomes, including trading frequency, types of transactions (e.g., margin trades, options), and other behaviours before and after new DEPs have been introduced would be almost as valuable. This additional data will enable the OSC and other regulators to set new, empirically-driven strategies based on high-quality evidence.
We particularly recommend further evidence generation on social interactions, rewards, and gamblification. Based on our literature scan, these are the behavioural techniques in our taxonomy that are likely to have the largest impact on behaviour.
In addition to collecting data focused on DEPs, we encourage regulators to generate and collect evidence and data on potential strategies to mitigate potentially negative impacts of DEPs on investor choices to determine if mitigation approaches are effective. For example, there are theoretical reasons to believe that imposing moments of frictions in executing a trade could, to a certain extent, counterbalance the tendency of some gamification techniques to encourage less deliberative trading decisions.
Last, we encourage more exploration of the positive impacts that gamification and other behavioural techniques can have on investor behaviours. For example, simplification of the user experience is likely to increase market participation, reduce confusion, and save investors time. Feedback techniques have proven very effective in educational contexts; digital trading platforms could use these same approaches to enhance their users' investing knowledge and expertise.
{1} U.S. Securities and Exchange Commission (2021, Aug. 27). SEC Requests Information and Comment on Broker-Dealer and Investment Adviser Digital Engagement Practices, Related Tools and Methods, and Regulatory Considerations and Potential Approaches; Information and Comments on Investment Adviser Use of Technology. Retrieved from: https://www.sec.gov/news/press-release/2021-167.
{2} Barber, B. M., & Odean, T. (2000). Trading is hazardous to your wealth: The common stock investment performance of individual investors. Journal of Finance, 55(2), 773-806.
{3} U.S. Securities and Exchange Commission (2021, Aug. 27). SEC Requests Information and Comment on Broker-Dealer and Investment Adviser Digital Engagement Practices, Related Tools and Methods, and Regulatory Considerations and Potential Approaches; Information and Comments on Investment Adviser Use of Technology. Retrieved from: https://www.sec.gov/news/press-release/2021-167.
{4} U.S. Securities and Exchange Commission (2021, Aug. 27). SEC Requests Information and Comment on Broker-Dealer and Investment Adviser Digital Engagement Practices, Related Tools and Methods, and Regulatory Considerations and Potential Approaches; Information and Comments on Investment Adviser Use of Technology. Retrieved from: https://www.sec.gov/news/press-release/2021-167.
{9} The overall relationship between trading and gambling is outside the scope of this research. While trading is distinct from gambling insofar as investors pursue long-term strategies (and invest in productive assets), there is a relationship between gambling and investing. Some traders are motivated by the thrill of potential short-term returns and treat trading as gambling. In their paper "Trading as Gambling," Dorn, Dorn and Sengmueller (2015) provide evidence for this, showing that when there are large lotteries, trading activity declines as people substitute lottery entries for trading.
{10} Grieve, R. & Lowe-Calverley, E. (2016, Jul 16). The power of rewards and why we seek them out. The Conversation.
{11} Jacobson, L. & Tamakloe, K. S. (2021, Aug 19). "Have vaccine lotteries worked? Studies so far show mixed results". Politifact.
{12} Griffiths, M., & Wood, R. (2001). The psychology of lottery gambling. International Gambling Studies, 1(1), 27-45.
{13} Burns, Z., Chiu, A., & Wu, G. (2010). Overweighting of small probabilities. In Wiley Encyclopedia of Operations Research and Management Science (pp. 1-8). Hoboken, NJ, USA: John Wiley & Sons.
{14} Skinner, B.F. (1969). Contingencies of reinforcement: A theoretical analysis. Meredith Corporation.
{15} Lagorio, C. H., & Winger, G. (2014). Random-ratio schedules produce greater demand for iv drug administration than fixed-ratio schedules in rhesus monkeys. Psychopharmacology, 231(15), 2981-2988.
{16} Miltenberger, R. G. (2008). "Behavioral Modification: Principles and Procedures". Florida, Thomson.
{17} Shull, R. L., & Grimes, J. A. (2006). Resistance to extinction following variable-interval reinforcement: Reinforcer rate and amount. Journal of the Experimental Analysis of Behavior, 85(1), 23-39.
{18} Egli, M., Schaal, D. W., Thompson, T., & Cleary, J. (1992). Opioid-induced response-rate decrements in pigeons responding under variable-interval schedules: reinforcement mechanisms. Behavioural Pharmacology.
{19} Haw, J. (2008). Random-ratio schedules of reinforcement: The role of early wins and unreinforced trials. Journal of Gambling Issues, (21), 56-67.
{20} Chaudhry, S., & Kulkarni, C. (2021, June). Design Patterns of Investing Apps and Their Effects on Investing Behaviors. In Designing Interactive Systems Conference 2021 (pp. 777-788).
{21} Croson, R., & Sundali, J. (2005). The gambler's fallacy and the hot hand: Empirical data from casinos. Journal of Risk and Uncertainty, 30(3), 195-209.
{22} Ayton, P., & Fischer, I. (2004). The hot hand fallacy and the gambler's fallacy: Two faces of subjective randomness?. Memory & cognition, 32(8), 1369-1378.
{23} Footnote source deleted re: Platform 10
{24} Kellner, C., Reinstein, D., & Riener, G. (2019). Ex-ante commitments to "give if you win" exceed donations after a win. Journal of Public Economics, 169, 109-127.
{25} Adam, M., Roethke, K., & Benlian, A. (2021). Gamblified digital product offerings: an experimental study of loot box menu designs. Electronic Markets, 1-16.
{26} Thaler, R. & Johnson, E. (1990), Gambling with the house money and trying to break even: The effects of prior outcomes to risky choice. Management Science, 36, (6), 643-660.
{27} Croson, R., & Sundali, J. (2005). The gambler's fallacy and the hot hand: Empirical data from casinos. Journal of Risk and Uncertainty, 30(3), 195-209.
{28} Odean, T. (1999). Do investors trade too much? American economic review, 89(5), 1279-1298.
{29} Johnson, D., Deterding, S., Kuhn, K. A., Staneva, A., Stoyanov, S., & Hides, L. (2016). Gamification for health and wellbeing: A systematic review of the literature. Internet Interventions, 6, 89-106. Also: Looyestyn, J., Kernot, J., Boshoff, K., Ryan, J., Edney, S., & Maher, C. (2017). Does gamification increase engagement with online programs? A systematic review. PloS one, 12(3), e0173403.
{30} Leibbrandt, A., Gneezy, U., & List, J. A. (2013). Rise and fall of competitiveness in individualistic and collectivistic societies. Proceedings of the National Academy of Sciences, 110(23), 9305-9308.
{31} Looyestyn, J., Kernot, J., Boshoff, K., Ryan, J., Edney, S., & Maher, C. (2017). Does gamification increase engagement with online programs? A systematic review. PloS one, 12(3), e0173403.
{32} Looyestyn, J., Kernot, J., Boshoff, K., Ryan, J., Edney, S., & Maher, C. (2017). Does gamification increase engagement with online programs? A systematic review. PloS one, 12(3), e0173403.
{33} Krause, M. Mogalle, M., Pohl, H. & Williams, J. J. (2015). "A playful game changer: fostering student retention in online education with social gamification". In Proceedings of the Second ACM Conference on Learning@Scale.
{34} Mekler, E. D., Brühlmann, F., Opwis, K., & Tuch, A. N. (2013, October). Do points, levels and leaderboards harm intrinsic motivation? An empirical analysis of common gamification elements. In Proceedings of the First International Conference on gameful design, research, and applications (pp. 66-73).
{35} Song, H., Kim, J., Tenzek, K. E., & Lee, K. M. (2010, June). The effects of competition on intrinsic motivation in exergames and the conditional indirect effects of presence. In Annual conference of the International Communication Association, Singapore.
{36} For further discussion of social comparison, see the section on Social Interactions, below.
{37} Biais, B., Hilton, D., Mazurier, K., & Pouget, S. (2005). Judgemental overconfidence, self-monitoring, and trading performance in an experimental financial market. The Review of Economic Studies, 72(2), 287-312.
{38} Looyestyn, J., Kernot, J., Boshoff, K., Ryan, J., Edney, S., & Maher, C. (2017). Does gamification increase engagement with online programs? A systematic review. PloS one, 12(3), e0173403.
{39} Looyestyn, J., Kernot, J., Boshoff, K., Ryan, J., Edney, S., & Maher, C. (2017). Does gamification increase engagement with online programs? A systematic review. PloS one, 12(3), e0173403.
{40} Tobon, S., Ruiz-Alba, J. L., & García-Madariaga, J. (2020). Gamification and online consumer decisions: Is the game over?. Decision Support Systems, 128, 113167.
{41} Hamari, J. (2017). Do badges increase user activity? A field experiment on the effects of gamification. Computers in Human Behavior, 71, 469-478.
{42} Van Osselaer, S. M., Alba, J. W., & Manchanda, P. (2004). Irrelevant information and mediated intertemporal choice. Journal of Consumer Psychology, 14(3), 257-270.
{43} Dorotic, M., Verhoef, P. C., Fok, D., & Bijmolt, T. H. (2014). Reward redemption effects in a loyalty program when customers choose how much and when to redeem. International Journal of Research in Marketing, 31(4), 339-355.
{44} Looyestyn, J., Kernot, J., Boshoff, K., Ryan, J., Edney, S., & Maher, C. (2017). Does gamification increase engagement with online programs? A systematic review. PloS one, 12(3), e0173403.
{45} Footnote source deleted re: Platform 8
{46} Footnote source deleted re: a US-based platform
{47} Chapkovski, P., Khapko, M., & Zoican, M. (2021). Does gamified trading stimulate risk taking?. SSRN 3971868.
{48} Kivetz, R., Urminsky, O., & Zheng, Y. (2006). The goal-gradient hypothesis resurrected: Purchase acceleration, illusionary goal progress, and customer retention. Journal of Marketing Research, 43(1), 39-58.
{49} Scheiber, N. (2017). How Uber uses psychological tricks to push its drivers' buttons. New York Times.
{50} Jensen, J. D., King, A. J., & Carcioppolo, N. (2013). Driving toward a goal and the goal-gradient hypothesis: the impact of goal proximity on compliance rate, donation size, and fatigue. Journal of Applied Social Psychology, 43(9), 1881-1895.
{51} Koo, M., & Fishbach, A. (2012). The small-area hypothesis: Effects of progress monitoring on goal adherence. Journal of Consumer Research, 39(3), 493-509.
{52} Kundisch, D., & von Rechenberg, T. (2017). Does the framing of progress towards virtual rewards matter? Business & Information Systems Engineering, 59(4), 207-222.
{53} Huynh, D., & Iida, H. (2017). An Analysis of Winning Streak's Effects in Language Course of "Duolingo". University Kebangsaan Malaysia Press.
{54} Uber (2022). "How does the Consecutive Trips promotion work?" Retrieved from: https://help.uber.com/driving-and-delivering/article/how-does-the-consecutive-trips-promotion-work?nodeId=de983305-076a-40cf-aaf4-7b23f50a0007. See also: Lyft (2022). "Streak Bonus". Retrieved from: https://help.lyft.com/hc/e/articles/115015748908-Streak-Bonus.
{55} There are financial apps which do not enable users to trade individual securities, offer such features, but are not included in the scope of this research.
{56} Odean, T. (1999). Do Investors Trade Too Much? American Economic Review, 89 (5): 1279-1298.
{57} Lewis, L. K., Rowlands, A. V., Gardiner, P. A., Standage, M., English, C., & Olds, T. (2016). Small steps: preliminary effectiveness and feasibility of an incremental goal-setting intervention to reduce sitting time in older adults. Maturitas, 85, 64-70.
{58} Johnson, D., Deterding, S., Kuhn, K. A., Staneva, A., Stoyanov, S., & Hides, L. (2016). Gamification for health and wellbeing: A systematic review of the literature. Internet Interventions, 6, 89-106.
{59} Nah, F. F. H., Zeng, Q., Telaprolu, V. R., Ayyappa, A. P., & Eschenbrenner, B. (2014, June). Gamification of education: a review of literature. In International conference on hci in business (pp. 401-409). Springer, Cham.
{60} Wisniewski, B., Zierer, K., & Hattie, J. (2020). The power of feedback revisited: A meta-analysis of educational feedback research. Frontiers in Psychology, 10, 3087.
{61} Scheiber, N. (2017, Apr 2). How Uber Uses Psychological Tricks to Push Its Drivers' Buttons. New York Times. Retrieved from: https://www.nytimes.com/interactive/2017/04/02/technology/uber-drivers-psychological-tricks.html.
{62} Auer, M. M., & Griffiths, M. D. (2016). Personalized behavioral feedback for online gamblers: A real world empirical study. Frontiers in Psychology, 1875.
{63} Carver, C. S., & Scheier, M. F. (2012). Attention and self-regulation: A control-theory approach to human behavior. Springer Science & Business Media.
{64} Kluger, A. N., & DeNisi, A. (1996). The effects of feedback interventions on performance: A historical review, a meta-analysis, and a preliminary feedback intervention theory. Psychological Bulletin, 119(2), 254.
{65} Footnote source deleted re: a US-based platform
{66} Footnote source deleted re: an US-based robo-advisor app
{67} Fenton-O'Creevy, M., Adam, M., Clough, G., Conole, G., Gaved, M., Lins, J. T., et al. (2015). A game based approach to improve traders' decision-making. In: The International Gamification for Business Conference 2015: Strategic Industrial Applications of Games and Gamification.
{68} FINRA (2021, Jun 30). "FINRA Requests Comment on Effective Methods to Educate Newer Investors". Retrieved from: https://www.finra.org/rules-guidance/notices/special-notice-063021#comments.
{69} Fenton-O'Creevy, M., Adam, M., Clough, G., Conole, G., Gaved, M., Lins, J. T., et al. (2015). A game based approach to improve traders' decision-making. In: The International Gamification for Business Conference 2015: Strategic Industrial Applications of Games and Gamification.
{70} Larson, F., List, J. A., & Metcalfe, R. D. (2016). Can myopic loss aversion explain the equity premium puzzle? Evidence from a natural field experiment with professional traders (No. w22605). National Bureau of Economic Research.
{71} U.S. Securities and Exchange Commission (n.d.) "Request for Information and Comments on Broker-Dealer and Investment Adviser Digital Engagement Practices, Related Tools and Methods, and Regulatory Considerations and Potential Approaches...". Retrieved from:https://business.cch.com/srd/34-92766.pdf.
{72} Ebert, N., Alexander Ackermann, K., & Scheppler, B. (2021, May). Bolder is Better: Raising User Awareness through Salient and Concise Privacy Notices. In Proceedings of the 2021 CHI Conference on Human Factors in Computing Systems (pp. 1-12).
{73} Cara, C. (2019). Dark patterns in the media: A systematic review. Network Intelligence Studies, 7(14), 105-113.
{74} Johnson, E. J., Shu, S. B., Dellaert, B. G., Fox, C., Goldstein, D. G., Häubl, G., & Weber, E. U. (2012). Beyond nudges: Tools of a choice architecture. Marketing Letters, 23(2), 487-504.
{75} Footnote source deleted re: Platform 7
{76} Footnote source deleted re: Platform 7
{77} Footnote source deleted re: Platform 7
{78} Footnote source deleted re: Platform 7
{79} Kalda, A., Loos, B., Previtero, A., & Hackethal, A. (2021). Smart (Phone) Investing? A within Investor-time Analysis of New Technologies and Trading Behavior (No. w28363). National Bureau of Economic Research. NB: this study did find that smartphone-trading did have a negative impact overall.
{80} The disposition effect refers to the well-established but "irrational" tendency for investors to sell securities that are worth more than their purchase price and hold on to those that are worth less.
{81} Frydman, C., & Wang, B. (2020). The impact of salience on investor behavior: Evidence from a natural experiment. Journal of Finance, 75(1), 229-276.
{82} Bali, T. G., Hirshleifer, D., Peng, L., & Tang, Y. (2021). Attention, social interaction, and investor attraction to lottery stocks (No. w29543). National Bureau of Economic Research.
{83} Arnold, M., Pelster, M., & Subrahmanyam, M. G. (2022). Attention triggers and investors' risk-taking. Journal of Financial Economics, 143(2), 846-875.
{84} Bettinger, E. P., Long, B. T., Oreopoulos, P., & Sanbonmatsu, L. (2012). The role of application assistance and information in college decisions: Results from the H&R Block FAFSA experiment. The Quarterly Journal of Economics, 127(3), 1205-1242.
{85} The Behavioral Insights Team. (2014). EAST: Four simple ways to apply behavioural insights.https://www.bi.team/wp-content/uploads/2015/07/BIT-Publication-EAST_FA_WEB.pdf.
{86} Mehra, A., Paul, J., & Kaurav, R. P. S. (2021). Determinants of mobile apps adoption among young adults: theoretical extension and analysis. Journal of Marketing Communications, 27(5), 481-509.
{87} Rodrigues, L. F., Oliveira, A., & Costa, C. J. (2016). Does ease-of-use contribute to the perception of enjoyment? A case of gamification in e-banking. Computers in Human Behavior, 61, 114-126.
{88} Fazio, L. (2020). Pausing to consider why a headline is true or false can help reduce the sharing of false news. Harvard Kennedy School Misinformation Review, 1(2).
{89} Charting Indicators include: Volume, Moving Average (MA), Exponential Moving Average (EMA), Relative Strength Index (RSI), Moving Average Convergence Divergence (MACD).
{90} Footnote source deleted re: Platform 7
{91} Footnote source deleted re: Platform 7
{92} Footnote source deleted re: Platform 7
{93} Investment Industry Regulatory Organization of Canada -- IIROC (2019, Apr 9). "Guidance on Order Execution Only Services and Activities". Retrieved from: https://www.iiroc.ca/news-and-publications/notices-and-guidance/guidance-order-execution-only-services-and-activities.
{94} Powell, L. (2021, September 14). SEC Investor Advisory Committee examines digital engagement practices [Blog post]. Retrieved from https://jimhamiltonblog.blogspot.com/2021/09/sec-investor-advisory-committee_14.html.
{95} Montag, C., Markowetz, A., Blaszkiewicz, K., Andone, I., Lachmann, B., Sariyska, R., ... & Markett, S. (2017). Facebook usage on smartphones and gray matter volume of the nucleus accumbens. Behavioural brain research, 329, 221-228.
{96} Sherman, L. E., Hernandez, L. M., Greenfield, P. M., & Dapretto, M. (2018). What the brain 'Likes': neural correlates of providing feedback on social media. Social cognitive and affective neuroscience, 13(7), 699-707.
{97} Hou, Y., Xiong, D., Jiang, T., Song, L., & Wang, Q. (2019). Social media addiction: Its impact, mediation, and intervention. Cyberpsychology: Journal of psychosocial research on cyberspace, 13(1).
{98} Footnote source deleted re: Platform 8
{99} Cutts, J. (2021, Sep 14). "Not all brokerages should 'gamify' a la Robinhood -- but others can/will go further." Traders Magazine
{100} Barber, B.M. and Odean, T. (2000), Trading Is Hazardous to Your Wealth: The Common Stock Investment Performance of Individual Investors. The Journal of Finance, 55: 773-806.
{101} Chaudhry, S., & Kulkarni, C. (2021, June). Design Patterns of Investing Apps and Their Effects on Investing Behaviors. In Designing Interactive Systems Conference 2021 (pp. 777-788).
{102} Chang, T. Y., Solomon, D. H., & Westerfield, M. M. (2016). Looking for someone to blame: Delegation, cognitive dissonance, and the disposition effect. The Journal of Finance, 71(1), 267-302.
{103} Liu, Y. Y., Nacher, J. C., Ochiai, T., Martino, M., & Altshuler, Y. (2014). Prospect theory for online financial trading. PloS one, 9(10), e109458.
{104} Tuah, N. M., Yoag, A., Ahmedy, F., & Baharum, A. (2019). A gamification and avatar self-representation application for diabetes self-management. Int. J. Adv. Trends Comput. Sci. Eng, 8, 401-407.
{105} Hswen, Y., Murti, V., Vormawor, A. A., Bhattacharjee, R., & Naslund, J. A. (2013). Virtual avatars, gaming, and social media: Designing a mobile health app to help children choose healthier food options. Journal of mobile technology in medicine, 2(2), 8.
{106} Kesel, W. (2020, Apr 1). 3 Avatar-Based Virtual Event Platforms for Planners to Consider. BizBash.com.
{107} Morschheuser, B., & Hamari, J. (2019). The gamification of work: Lessons from crowdsourcing. Journal of Management Inquiry, 28(2), 145-148.
{108} De Groot, J. I., Abrahamse, W., & Jones, K. (2013). Persuasive normative messages: The influence of injunctive and personal norms on using free plastic bags. Sustainability, 5(5), 1829-1844.
{109} Allcott, H., & Rogers, T. (2014). The short-run and long-run effects of behavioral interventions: Experimental evidence from energy conservation. American Economic Review, 104(10), 3003-37.
{110} Ceschi, A., Sartori, R., Dickert, S., Scalco, A., Tur, E. M., Tommasi, F., & Delfini, K. (2021). Testing a norm-based policy for waste management: An agent-based modeling simulation on nudging recycling behavior. Journal of Environmental Management, 294, 112938.
{111} Behavioral Insights Team (2014). EAST: Four simple ways to apply behavioural insights. Retrieved from: https://www.bi.team/wp-content/uploads/2015/07/BIT-Publication-EAST_FA_WEB.pdf.
{112} Sparkman, G., & Walton, G. M. (2017). Dynamic norms promote sustainable behavior, even if it is counternormative. Psychological science, 28(11), 1663-1674.
{113} Footnote source deleted re: Platform 7
{114} Sherif, M. (1935). A study of some social factors in perception. Archives of Psychology, 27: 187.
{115} Investors were defined as such by holding at least one of: individually held stocks, ETFs, securities or derivatives, bonds or notes other than Canada Savings Bonds, mutual funds, or private equity investments.
{116} Participants in the points condition also earned compensation based on the number of trades they made, with each trade earning 100 points and 1,200 points being worth $0.01 in additional compensation. As a result, the maximum value of these points was only $0.075, a negligible but non-zero economic value. This reflects how points are likely to be used by trading platforms based on our environmental scan.
{117} Our threshold for significance (p < 0.008) includes a Benjamini-Hochberg correction for multiple comparisons and represents a more conservative approach to statistical significance compared to the usual threshold of 0.05. Any results with p-values above 0.008 should be considered suggestive as they do not meet the pre-specified threshold for statistical significance. Error bars represent a 95% confidence interval.
{118} Note on interpreting bar graphs in this report: The height of the control group's bar represents the average outcome observed for participants in the control condition. The height of the experimental groups' bars represent what we think would have happened to control group participants if they had been treated in the way the experimental groups were. In other words, the heights of the Points and Top Traded List groups represent the height of the control group average plus our estimate of the effect of the treatment (based on our analysis, which controls for covariates about participants in all groups).
{119} Odean, T. (1999). Do investors trade too much? American economic review, 89(5), 1279-1298.
{120} This was measured using the inverse of an indicator of deviation (in terms of sum of squared errors) from a uniform distribution of resources across all available investments, which we labelled a 'Diversification Index'. A value of 1 would mean a completely equal distribution of funds across the stocks. A value of 0 would mean that only one stock was held. Additional details on this measure are available in Appendix C.
{121} The number of participants analyzed (n) varies for these analyses as they only includes participants who helds stocks across each week in the experiment.
{122} Supplemental analyses focused on stock selling and holding further elucidate these findings. On average, participants who saw the top traded lists had a 49% likelihood of selling a top traded stock in a given week, an 11% increase relative to participants in the control group (who had a 44% chance of selling a top traded stock). Overall, 51% of the stocks held by the group that saw the top traded list were on that list, a 7% relative increase compared to the control group (48%).
{123} Barber, B. M., Huang, X., Odean, T., & Schwarz, C. (2020). Attention induced trading and returns: Evidence from Robinhood users. Journal of Finance (Forthcoming).
{124} Barber, B.M. and Odean, T. (2000), Trading Is Hazardous to Your Wealth: The Common Stock Investment Performance of Individual Investors. The Journal of Finance, 55: 773-806.
{125} All participants started the simulation with $10,000 and, on average, ended with fund values ranging from $12,395 to $12,516 across groups.
{126} For each participant, we calculated a disposition effect index that varied between 0 and 1, where 1 represented a total disposition effect -- that is, a hypothetical situation in which a participant always retains losing stocks and always sells winning stocks. A value of 0.5 was indicative of neutral behaviour -- i.e., participants being no more likely to lean towards buying or selling as a result of a winning or losing outcome. We do not observe a disposition effect across groups as the average disposition effect index was below 0.5 for all groups. Additional details on our disposition effect calculations are available in Appendix C (Experimental Research Analysis Technical Details).
{127} To do so, we regressed each participants' disposition effect coefficient on their frequency of trading.
{128} Barber, B. M., Huang, X., Odean, T., & Schwarz, C. (2020). Attention induced trading and returns: Evidence from Robinhood users. Journal of Finance (Forthcoming).
{129} Chapkovski, P., Khapko, M., & Zoican, M. (2021). Does gamified trading stimulate risk taking?
{130} Chapkovski, P., Khapko, M., & Zoican, M. (2021). Does gamified trading stimulate risk taking?
{131} Note: While diversification would usually also take into account some measure of riskiness (e.g. having a good balance of riskiness of stocks), as well as the overall quantity of investments, ours purely takes into account the "spread" of money across different stock options. This is because: (1) stocks included in this experiment have been designed to have very similar risk profiles, and (2) the experiment specifies a low ceiling for quantity of investments and thus requires a metric of diversification that is 'blind' to the total number of possible investments.
Table 1. Gamification and behavioural tactics identified on retail investing platforms surveyed in the period of 1-30 September 2021.
GAMIFICATION & OTHER BEHAVIOURAL TACTICS |
|||||||||||
|
|||||||||||
Location* |
How platform was reviewed |
Gamblification |
Leaderboards |
Rewards |
Social inter-actions |
Social norms |
Salient prompts |
Progress framing |
Feedback |
Simplification |
|
|
|||||||||||
Platform 1 |
Canada |
Android (demo) |
No |
No |
No |
Yes |
Yes |
No |
No |
No |
Yes |
|
|||||||||||
Platform 2 |
USA |
Android (demo) |
Yes |
Yes |
No |
Yes |
Yes |
Yes |
No |
No |
No |
|
|||||||||||
Platform 3 |
Canada/USA |
Web (demo) |
No |
No |
No |
No |
Yes |
No |
No |
No |
Yes |
|
|||||||||||
Platform 4 |
Canada |
iOS (demo) |
No |
No |
No |
No |
No |
No |
No |
No |
Yes |
|
|||||||||||
Platform 5 |
Canada |
iOS (demo) |
No |
No |
No |
Yes |
No |
No |
No |
No |
No |
|
|||||||||||
Platform 6 |
Canada |
Android (account) |
No |
No |
No |
No |
No |
No |
No |
No |
|
|
|||||||||||
Platform 7 |
USA |
Web search |
Yes |
No |
No |
No |
Yes |
Yes |
No |
No |
Yes |
|
|||||||||||
Platform 8 |
USA |
Web search |
Yes |
Yes |
Yes |
Yes |
Yes |
No |
No |
No |
No |
|
|||||||||||
Platform 9 |
USA |
Web search |
No |
No |
No |
No |
No |
No |
No |
No |
No |
|
|||||||||||
Platform 10 |
Canada |
iOS (account) |
Yes |
No |
Yes |
No |
Yes |
Yes |
No |
No |
Yes |
|
|||||||||||
Platform 11 |
USA |
Android (demo) |
No |
No |
Yes |
Yes |
Yes |
Yes |
No |
No |
No |
|
|||||||||||
Platform 12 |
USA |
iOS (demo) |
No |
No |
No |
No |
Yes |
No |
No |
No |
Yes |
Legend and Notes
• Platforms were reviewed on Android, iOS or Web.
• Some platforms enabled us to review features without creating an account. These platforms are labelled "(demo)" in the table above.
• Where we needed to create an account to review the features, the platforms are labelled "(account)".
• If we could not create an account (e.g., for certain US platforms), we conducted a web search (e.g., review of videos, news articles) to try to identify gamification and other behaviourally-informed features. These platforms are labelled "web search."
• We attempted to review a Canadian bank's platform, but investigating any features required provision of banking details. We attempted a web search but the information available was quite limited. To the best of our understanding, it does not include any gamification or other behavioural tactics, but because of the limitations we did not want to include it in this table due to the limitations of our review.
**These are the jurisdictions where these platforms are available to retail investors.
Results by Experiment Group
Primary analysis: Trading frequency
Total Trades |
|||||
|
|||||
Group |
Mean |
Standard Deviation |
Minimum value |
Maximum value |
Observations |
|
|||||
Control |
18.44 |
16.84 |
1 |
90 |
803 |
|
|||||
Points |
25.51 |
20.06 |
1 |
90 |
811 |
|
|||||
Top Traded List |
18.90 |
16.38 |
1 |
90 |
816 |
|
|||||
N = 2,430 |
|||||
Regression analysis:
The regression coefficient on the Points condition, 7.19 (CI: 5.4, 9.0), shows that random assignment to the Points group caused participants to, on average, conduct approximately 7 more trades compared to participants in the control group (p=0.00). Therefore, exposure to the Point-based rewards increased trading frequency by 39%. The regression coefficient on the Top Traded condition, 0.57 (CI: -1.0, 2.2), was not statistically significant (p=0.49).
Average Diversification Index |
|||||
|
|||||
Group |
Mean |
Standard Deviation |
Minimum value |
Maximum value |
Observations |
|
|||||
Control |
0.70 |
0.27 |
0 |
1 |
803 |
|
|||||
Points |
0.69 |
0.27 |
0 |
1 |
811 |
|
|||||
Top Traded List |
0.70 |
0.27 |
0 |
1 |
816 |
|
|||||
N = 2,430 |
|||||
Regression analysis:
Regression coefficients were similar and not statistically significant for the Points condition (-0.01; CI: -0.03, 0.02; p=0.62) and the Top traded condition (0.01; CI: -0.02, 0.03; p=0.54).
Exploratory analyses
Average Ratio of Top Traded Stocks Held |
|||||
|
|||||
Group |
Mean |
Standard Deviation |
Minimum value |
Maximum value |
Observations |
|
|||||
Control |
0.48 |
0.13 |
0.08 |
1 |
780 |
|
|||||
Points |
0.48 |
0.12 |
0.04 |
1 |
802 |
|
|||||
Top Traded List |
0.50 |
0.14 |
0 |
1 |
791 |
|
|||||
N = 2,373 |
|||||
Regression analysis:
The OLS regression coefficient, 0.035 (CI: 0.02, 0.05; p=0.00) suggests that exposure to a list labelling a number of stocks as "top traded" was associated with a 7% increase in the ratio of these stock holdings. In contrast, the regression coefficient on the Points condition, 0.01 (CI: -0.01, 0.02), was not statistically significant (p=0.41).
Average Ratio of Top Traded Stocks Sold |
|||||
|
|||||
Group |
Mean |
Standard Deviation |
Minimum value |
Maximum value |
Observations |
|
|||||
Control |
0.44 |
0.26 |
0 |
1 |
670 |
|
|||||
Points |
0.45 |
0.22 |
0 |
1 |
725 |
|
|||||
Top Traded List |
0.49 |
0.26 |
0 |
1 |
696 |
|
|||||
N = 2,091 |
|||||
Regression analysis:
The OLS regression coefficient, 0.049 (CI: 0.02, 0.08; p=0.00) suggests that exposure to a list labelling a number of stocks as "top traded" was associated with an 11% increase in the ratio of these stock sold. In contrast, the regression coefficient on the Points condition, 0.005 (CI: -0.02, 0.03), was not statistically significant (p=0.72).
Average Ratio of Top traded Stocks Bought and Sold |
|||||
|
|||||
Group |
Mean |
Standard Deviation |
Minimum value |
Maximum value |
Observations |
|
|||||
Control |
0.44 |
0.19 |
0 |
1 |
803 |
|
|||||
Points |
0.45 |
0.17 |
0 |
1 |
811 |
|
|||||
Top Traded List |
0.50 |
0.21 |
0 |
1 |
816 |
|
|||||
N = 2,430 |
|||||
Regression analysis:
The OLS regression coefficient, 0.065 (CI: 0.05, 0.08; p=0.00) suggests that exposure to a list labelling a number of stocks as "top traded" was associated with a 14% increase in the ratio of these stock sold. In contrast, the regression coefficient on the Points condition, 0.08 (CI: -0.01, 0.03), was not statistically significant (p=0.35).
Final Fund Value |
|||||
|
|||||
Group |
Mean |
Standard Deviation |
Minimum value |
Maximum value |
Observations |
|
|||||
Control |
12,394.63 |
1952.09 |
5379 |
22,448 |
803 |
|
|||||
Points |
12,420.80 |
1991.44 |
5695 |
22,197 |
811 |
|
|||||
Top Traded List |
12,515.81 |
2071.25 |
6784 |
22,047 |
816 |
|
|||||
N = 2,430 |
|||||
Regression analysis:
Regression coefficients were not statistically significant for the Points condition (44.5; CI: -149.4, 238.3; p=0.65) and the Top Traded condition (133.4; CI: -64.5, 331.3; p=0.19).
Average Disposition Effect |
|||||
|
|||||
Group |
Mean |
Standard Deviation |
Minimum value |
Maximum value |
Observations |
|
|||||
Control |
0.33 |
0.15 |
0 |
0.86 |
803 |
|
|||||
Points |
0.34 |
0.17 |
0 |
1 |
811 |
|
|||||
Top Traded List |
0.34 |
0.15 |
0 |
1 |
816 |
|
|||||
N = 2,430 |
|||||
Regression analysis:
Regression coefficients for the Points (0.01; CI: -0.01, 0.02; p=0.36) and Top Traded (0.01; CI: -0.01, 0.02; p=0.45) conditions were not statistically significant.
Background Questions and Demographics
Investor Status |
|
|
|
Reports holding an investment product (i.e., individually held stocks, ETFs, securities or derivatives, bonds or notes other than Canada Savings Bonds, mutual funds, or private equity investments. |
55.27% |
|
|
Does not report holding an investment product |
44.73% |
|
|
N = 2,430 |
|
Gender |
|
|
|
Female |
49.26% |
|
|
Male |
50.00% |
|
|
Other |
0.74% |
|
|
N = 2,430 |
|
Province |
|
|
|
Ontario |
46.30% |
|
|
Alberta |
13.17% |
|
|
British Columbia |
12.72% |
|
|
Quebec |
10.53% |
|
|
Manitoba |
4.94% |
|
|
Nova Scotia |
3.79% |
|
|
Saskatchewan |
3.25% |
|
|
New Brunswick |
3.21% |
|
|
Newfoundland and Labrador |
1.40% |
|
|
Prince Edward Island |
0.45% |
|
|
Northwest Territories |
0.12% |
|
|
Nunavut |
0.08% |
|
|
Yukon |
0.04% |
|
|
N = 2,430 |
|
Age |
|
|
|
18-24 |
10.62% |
|
|
25-24 |
24.90% |
|
|
35-44 |
25.80% |
|
|
45-54 |
18.89% |
|
|
55-65 |
19.79% |
|
|
N = 2,430 |
|
Ethnicity |
|
|
|
Asian (including Chinese, Japanese, Korean, etc.) |
10.25% |
|
|
Black / African Canadian / Caribbean |
5.57% |
|
|
British / Scottish / Irish / Welsh |
16.09% |
|
|
Canadian only |
29.55% |
|
|
Eastern European, including Russia |
2.43% |
|
|
Hispanic / Latin American |
2.26% |
|
|
Middle Eastern |
5.27% |
|
|
South Asian (including India, Pakistan, Sri Lanka, Bangladesh, Nepal) |
2.96% |
|
|
Southeast Asian (including Burma, Thailand, Vietnam, Laos, Cambodia, Philippines, Singapore, etc.) |
12.30% |
|
|
Western European |
3.42% |
|
|
First Nations / Métis / Inuit |
6.38% |
|
|
Other |
3.62% |
|
|
N = 2,430 |
|
Household Annual Income Before Taxes |
|
|
|
Less than $14,999 |
8.07% |
|
|
$15,000 to $19,999 |
3.74% |
|
|
$20,000 to $22,499 |
3.91% |
|
|
$22,500 to $24,999 |
1.93% |
|
|
$25,000 to $27,499 |
3.09% |
|
|
$27,500 to $29,999 |
2.63% |
|
|
$30,000 to $32,499 |
3.13% |
|
|
$32,500 to $34,999 |
2.63% |
|
|
$35,000 to $37,499 |
2.67% |
|
|
$37,500 to $39,999 |
2.51% |
|
|
$40,000 to $42,499 |
3.00% |
|
|
$42,500 to $44,999 |
2.51% |
|
|
$45,000 to $47,499 |
2.76% |
|
|
$47,500 to $49,999 |
2.96% |
|
|
$50,000 to $52,499 |
3.87% |
|
|
$52,500 to $54,999 |
1.73% |
|
|
$55,000 to $59,999 |
4.40% |
|
|
$60,000 to $69,999 |
6.83% |
|
|
$70,000 to $79,999 |
7.08% |
|
|
$80,000 to $89,999 |
5.06% |
|
|
$90,000 to $99,999 |
4.65% |
|
|
$100,000 to $124,999 |
8.19% |
|
|
$125,000 to $149,999 |
3.83% |
|
|
$150,000 and above |
4.77% |
|
|
Prefer not to say |
4.03% |
|
|
N = 2,430 |
|
Employment Status |
|
|
|
Employed full-time |
48.77% |
|
|
Employed part-time |
11.03% |
|
|
Self-employed full-time |
4.98% |
|
|
Self-employed part-time |
3.46% |
|
|
Active military |
0.25% |
|
|
Inactive military/Veteran |
0.04% |
|
|
Temporarily unemployed |
8.68% |
|
|
Full-time homemaker |
5.60% |
|
|
Retired |
7.13% |
|
|
Student |
5.68% |
|
|
Disabled |
3.58% |
|
|
Prefer not to answer |
0.82% |
|
|
N = 2,430 |
|
Highest Level of Education Completed |
|
|
|
3rd Grade or less |
4.90% |
|
|
Middle School -- Grades 4 -- 8 |
19.05% |
|
|
Completed some high school |
14.65% |
|
|
High school graduate |
26.46% |
|
|
Other post high school vocational training |
4.16% |
|
|
Completed some college, but no degree |
17.49% |
|
|
College/University Degree |
12.31% |
|
|
Prefer not to say |
0.99% |
|
|
N = 2,430 |
|
Device used to complete activity |
|
|
|
Desktop computer |
41.40% |
|
|
Mobile phone |
54.84% |
|
|
Tablet |
3.76% |
|
|
N = 2,430 |
|
Self-reported overall knowledge of financial matters |
|
|
|
Very low |
12.35% |
|
|
Low |
23.09% |
|
|
Average |
48.81% |
|
|
High |
12.30% |
|
|
Very high |
3.46% |
|
|
N = 2,430 |
|
Objective knowledge score |
|
|
|
0/3 questions correctly answered |
13.46% |
|
|
1/3 questions correctly answered |
26.05% |
|
|
2/3 questions correctly answered |
43.50% |
|
|
3/3 questions correctly answered |
17.00% |
|
|
N = 2,430 |
|
Years of experience holding an investment account |
|
|
|
0 |
46.30% |
|
|
Between 0 and 5 |
28.31% |
|
|
Between 5 and 10 |
9.59% |
|
|
Between 10 and 15 |
3.99% |
|
|
Between 15 and 20 |
4.98% |
|
|
Between 20 and 25 |
2.30% |
|
|
Between 25 and 30 |
2.31% |
|
|
More than 30 |
2.22% |
|
|
N = 2,430 |
|
Type of management of primary investment account |
|
|
|
I work with, or have, an advisor or portfolio manager or exempt market dealer |
22.14% |
|
|
I use an online investment adviser/robo-adviser that selects investments on my behalf (e.g., Wealth Simple, Questrade, Nest Wealth) |
10.16% |
|
|
I am a self-directed investor, I do not work with an advisor and I manage my own investments through a discount brokerage (order execution only account), mostly through an online platform on my computer |
12.47% |
|
|
I am a self-directed investor, I do not work with an advisor and I manage my own investments through a discount brokerage (order execution only account), mostly through an app on my phone or tablet |
8.31% |
|
|
I only have investments through my employer'spension plan |
2.18% |
|
|
N/A |
44.73% |
|
|
N = 2,430 |
|
Attitude towards risk when making investing decisions |
|
|
|
I am very conservative and try to minimize risk and avoid the possibility of any loss |
26.21% |
|
|
I am I am conservative but willing to accept a small amount of risk and possibility of loss |
39.67% |
|
|
I am willing to accept a moderate level of risk and tolerate moderate losses to achieve potentially higher returns |
28.68% |
|
|
I am aggressive and typically take on significant risk. I can tolerate large losses for the potential of achieving higher returns |
5.43% |
|
|
N = 2,430 |
|
Trading Frequency
To assess differences in the number of trade decisions made between the control condition (Group 1) and each of the two experimental conditions (Groups 2 and 3), we examined the treatment effect of condition using an OLS regression model:
Where:
i represents the individual, with Vari representing the value of hypothetical variable Var for the ith >participant
Freq is our outcome variable, which represents trade number counts and takes on values ranging from 1 to 90 (the number of trading instances in the experiment and thus the maximum possible trade count a participant can have).
T is a categorical indicator for the treatment groups, which is to be used as a predictor of the outcome variable and can take on the value of 0, 1, or 2
[BGR] is the coefficient of interest -- a scalar which represents the impact that being assigned to each of the three groups has on the number of trades a participant makes
[AGR] is the regression constant
e is the error term
Diversification Index
Our diversification index (DI) involves summing the squares of deviation from uniform allocation for each given stock, and then dividing the sum by the score participants would get if they concentrated all their funds into a single stock. Doing this yields a value that varies continuously between 0 and 1, where 1 = anti-diversification. Subtracting this amount from 1 then allows us to flip this value into a 0 to 1 scale where 0 represents anti-diversification and 1 represents maximal diversification (as defined by equal allocation of funds across all investment options).{131}
As defined for a single simulated week, the DI was estimated as follows:
Where:
M equals the total amount of money held by each investor at each experiment screen.
M/6 represents the amount that would be invested in that stock if the investor engaged in uniform distribution of funds across all the available stocks (e.g., at experiment onset, $10,000/6=$1666.67).
n represents each stock, 1-6
X_n is the amount invested in stock option n
H represents the sum of squared errors that a participant would receive if they allocated all their funds into a single stock to the detriment of all other options. This differs across simulated weeks due to the variation in available funds.
To assess differences in the Diversification Index (DI) between the control condition (Group 1) and each of the two experimental conditions (Groups 2 and 3), we examined the treatment effect of condition using an OLS regression model:
Where:
i represents the individual, with Vari representing the value of hypothetical variable Var for the ith participant
DI is our outcome variable, which varies continuously between 0 and 1
T is a categorical indicator for the treatment groups, which is to be used as a predictor of the outcome variable and can take on the value of 0, 1, or 2
[BGR] is the coefficient of interest -- a scalar which represents the impact that being assigned to each of the three groups has on a participant's diversification index
[AGR] is the regression constant
e is the error term
Disposition Effects
For each participant, we calculated a disposition effect coefficient as follows:
Here, fractions marked in blue served the purpose of differentially weighting decisions made in the loss and gain domains based on the relative frequencies of gains and losses in the total pool of investment outcomes.
The resulting index varies between 0 and 1, where 1 represents complete disposition -- that is, a hypothetical situation in which a participant always retains losing stocks and always sells winning stocks. A value of 0.5 should be indicative of neutral behaviour -- i.e., participants being no more likely to lean towards buying or selling as a result of a winning or losing outcome. Each participants' disposition effect coefficient was calculated for each week of trading and averaged to yield a single measure.
To assess for potential differences in the disposition effect (DE) between the control condition (Group 1) and each of the two experimental conditions (Groups 2 and 3), we examined the treatment effect of condition using an OLS regression model:
Where:
i represents the individual, with Vari representing the value of hypothetical variable Var for the ith participant
T is a categorical indicator for our treatment groups, which is to be used as a predictor of the outcome variable and can take on the value of 0, 1, or 2
[BGR] is the coefficient of interest -- a scalar which represents the impact that being assigned to each of the three groups has on a participant's disposition effect
[AGR] is the regression constant
e is the error term
Further, to assess for a potential impact of disposition effect on overall trading frequency, we used an OLS regression mode as follows:
Where:
i represents the individual, with Vari representing the value of hypothetical variable Var for the ith participant
Freq is our outcome variable, which represents trade number counts and takes on values ranging from 0 to 90 (the number of trading opportunities in the experiment and thus the maximum possible trade count a participant can have).
DE is a continuous measure of the disposition effect, which takes on values between 0 and 1 and serves as our independent variable
[BGR] is the coefficient of interest -- a scalar which represents the impact that each additional unit on the disposition effect scale has on a participant's frequency of trading
[AGR] is the regression constant
e is the error term
Exposure to Top Traded List
We compared the proportion of individuals' stock ownership that consists of stocks featured on a top traded list in Group 3 with the proportions derived using those same stocks in Groups 1 and 2. This fraction was computed separately for each simulated trading week as shown below, prior to being averaged across these weeks

Individual participants' fractions (which we termed stock ratios; SR) then served as inputs for an OLS regression model as follows:
Where:
i represents the individual, with Vari representing the value of hypothetical variable Var for the ith participant
SR is our outcome variable, which represents a fraction varying continuously between 0 and 1 (where 1 represents 100% of all stock ownership being confined to the top traded list)
T is a binary indicator for the treatment groups, which is to be used as a predictor of the outcome variable and can take on the value of 0 (given to all participants in Groups 1 and 2) or 1 (given to participants in Group 3, which are 'positive' for the top traded stock list exposure)
[BGR] is the coefficient of interest -- a scalar which represents the impact of the presence or absence of a top traded list on purchasing decisions
[AGR] is the regression constant
e is the error term
Introduction screens (all conditions)

Trading screens
Control condition
Control condition initial allocation of funds
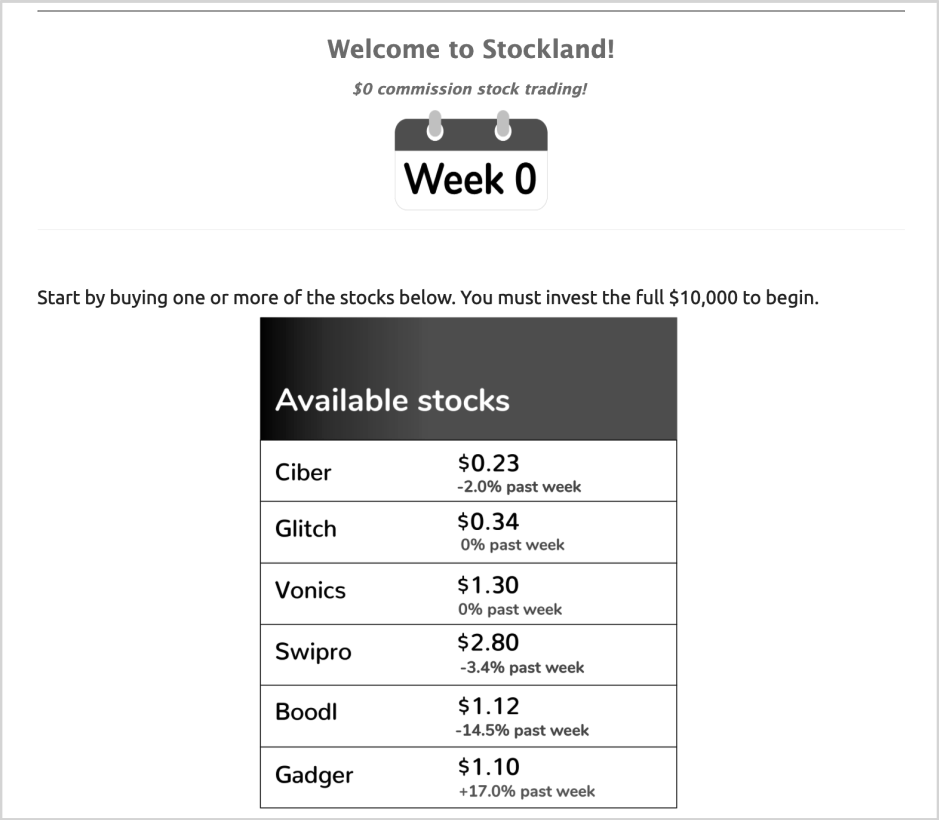
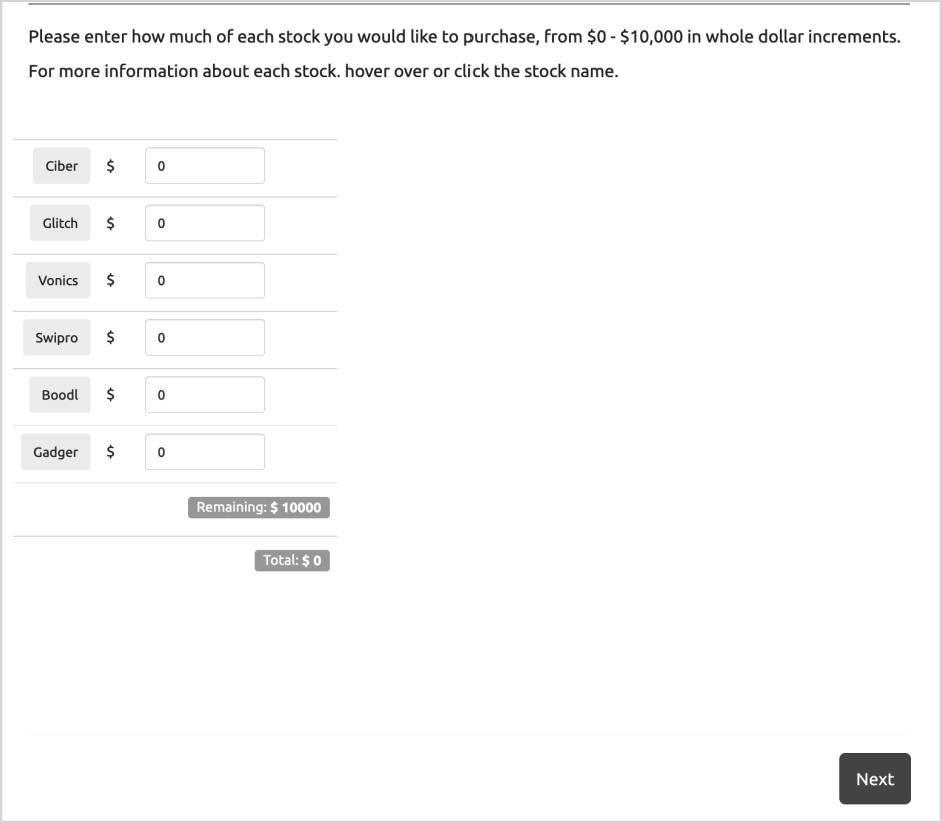
Control condition transition screen (included between all 'weeks' of trading)

Sample control condition selling screen

Sample control condition buying screen
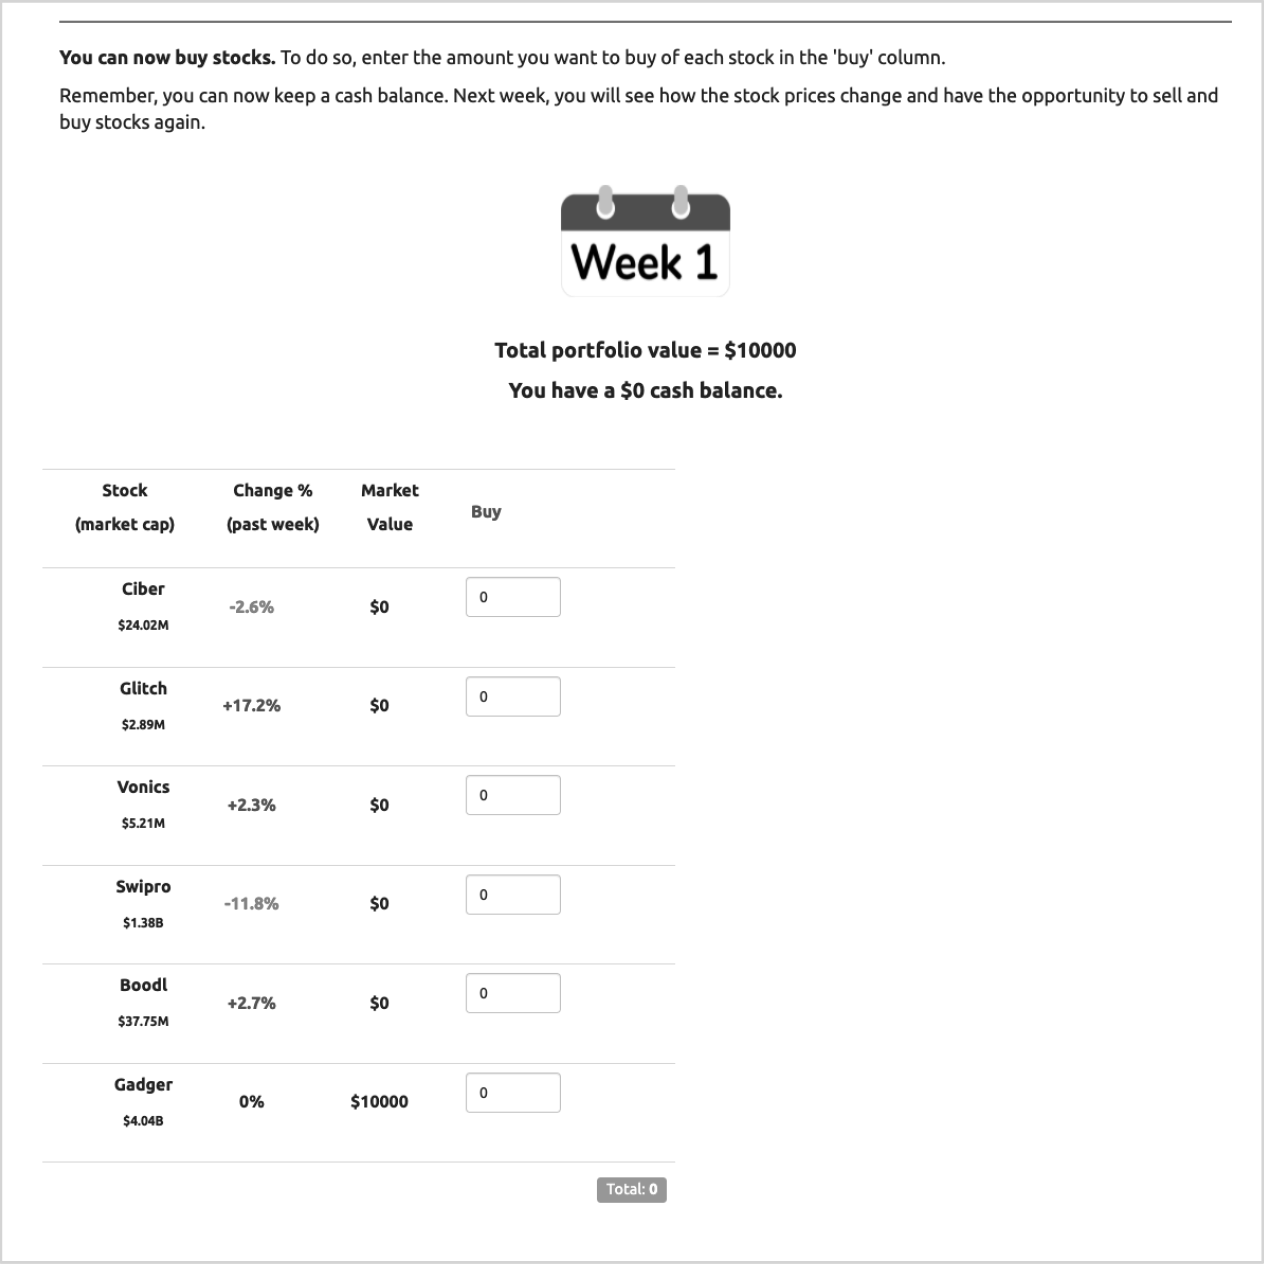
Points condition
Points condition initial allocation of funds

Points condition transition screen (included between all 'weeks' of trading)

Sample control condition selling screen

Sample control condition buying screen

Top Traded List condition
Top traded condition initial allocation of funds
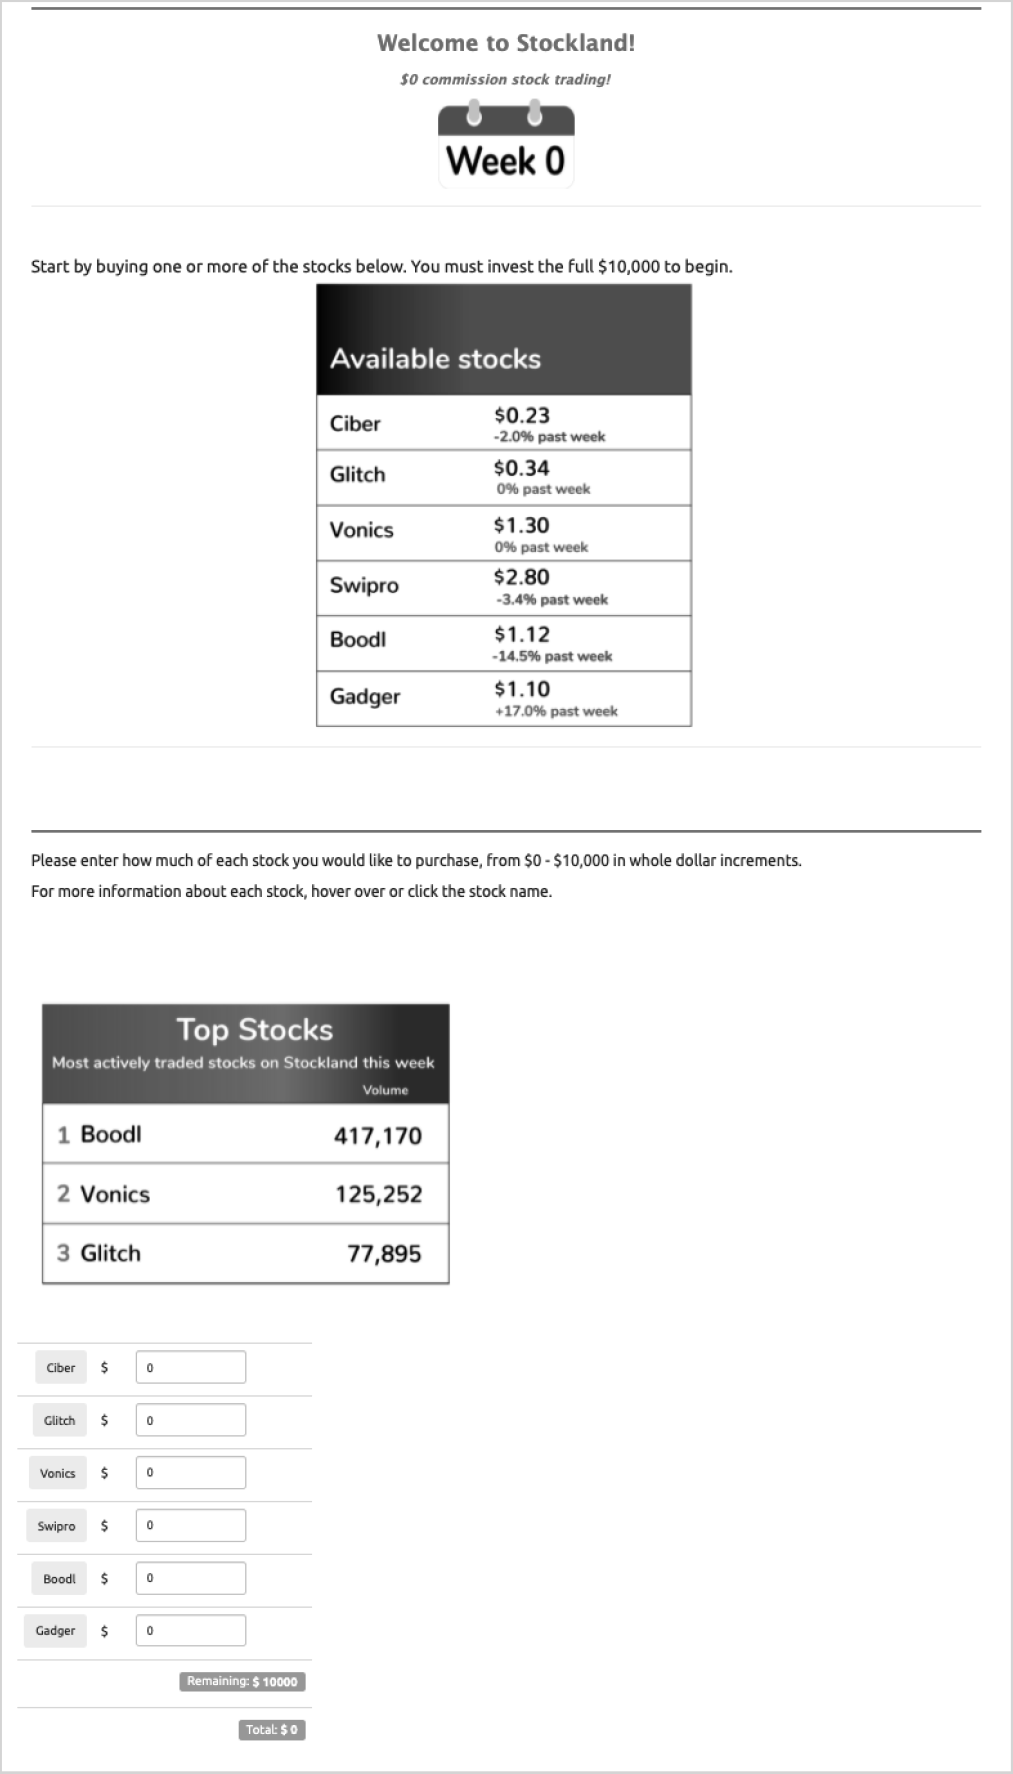
Top traded condition transition screen (included between all 'weeks' of trading)

Sample top traded condition selling screen
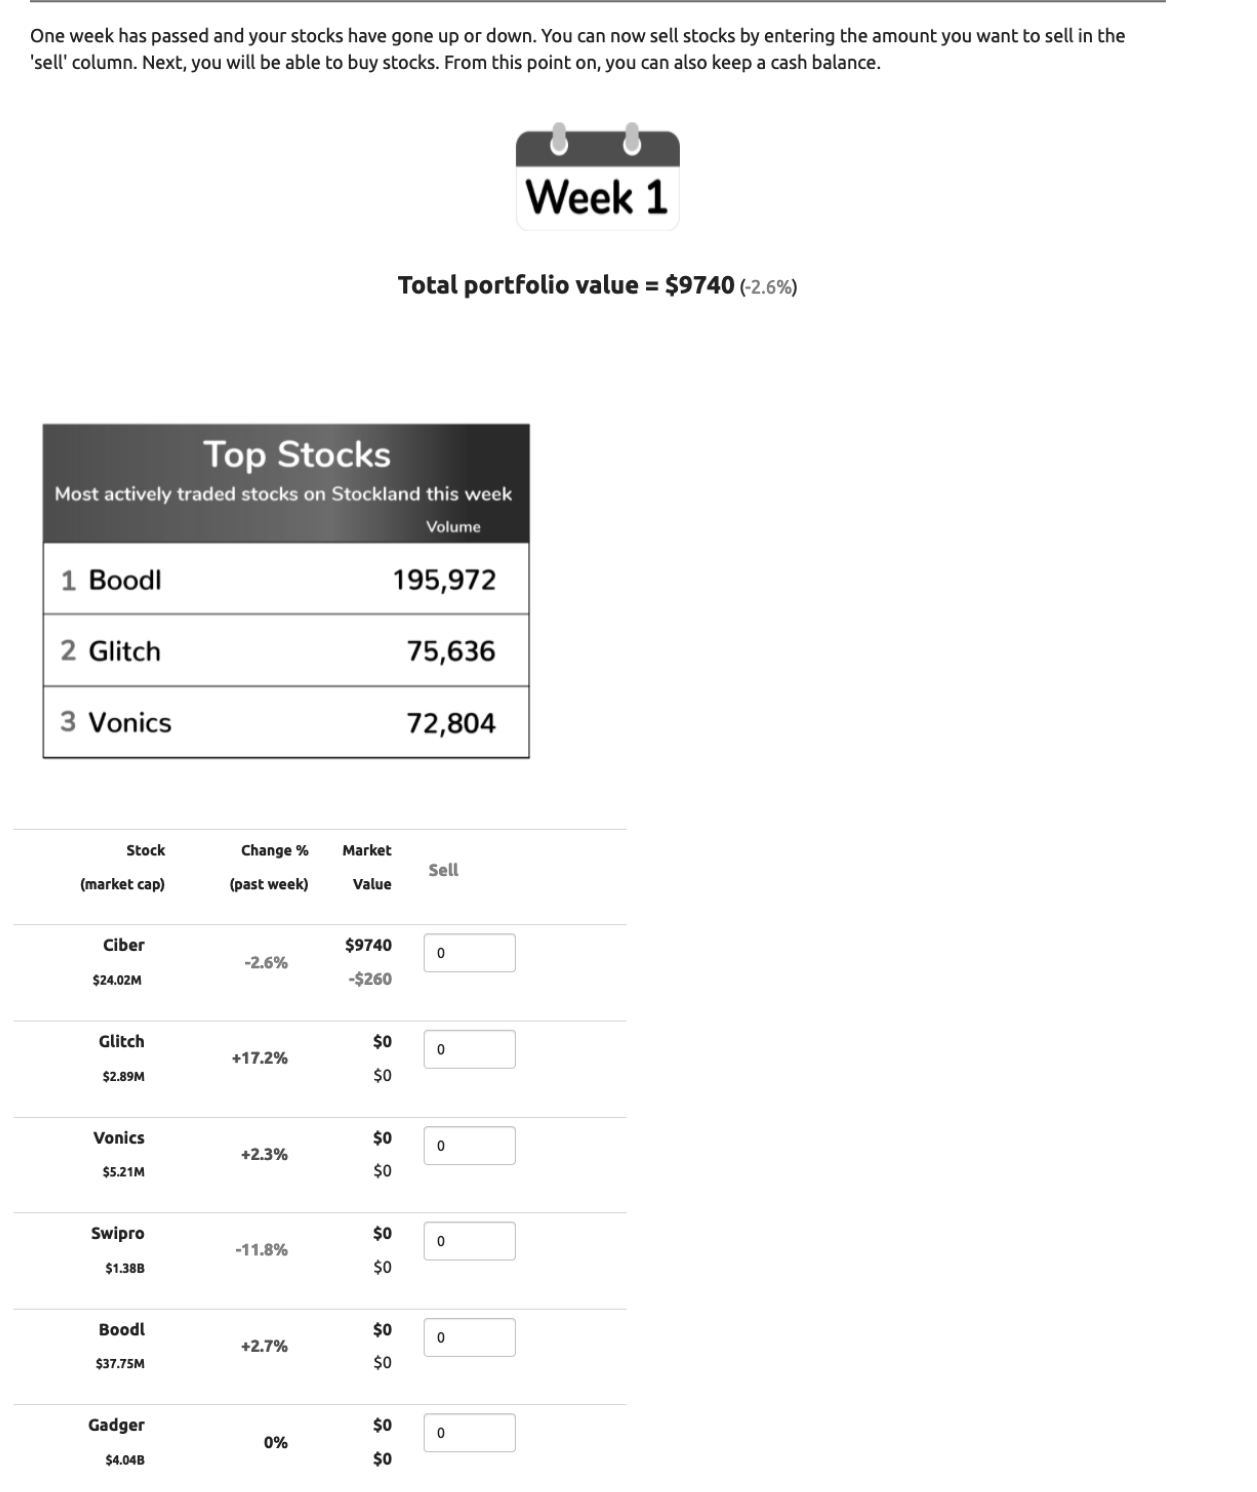
Sample top traded condition buying screen
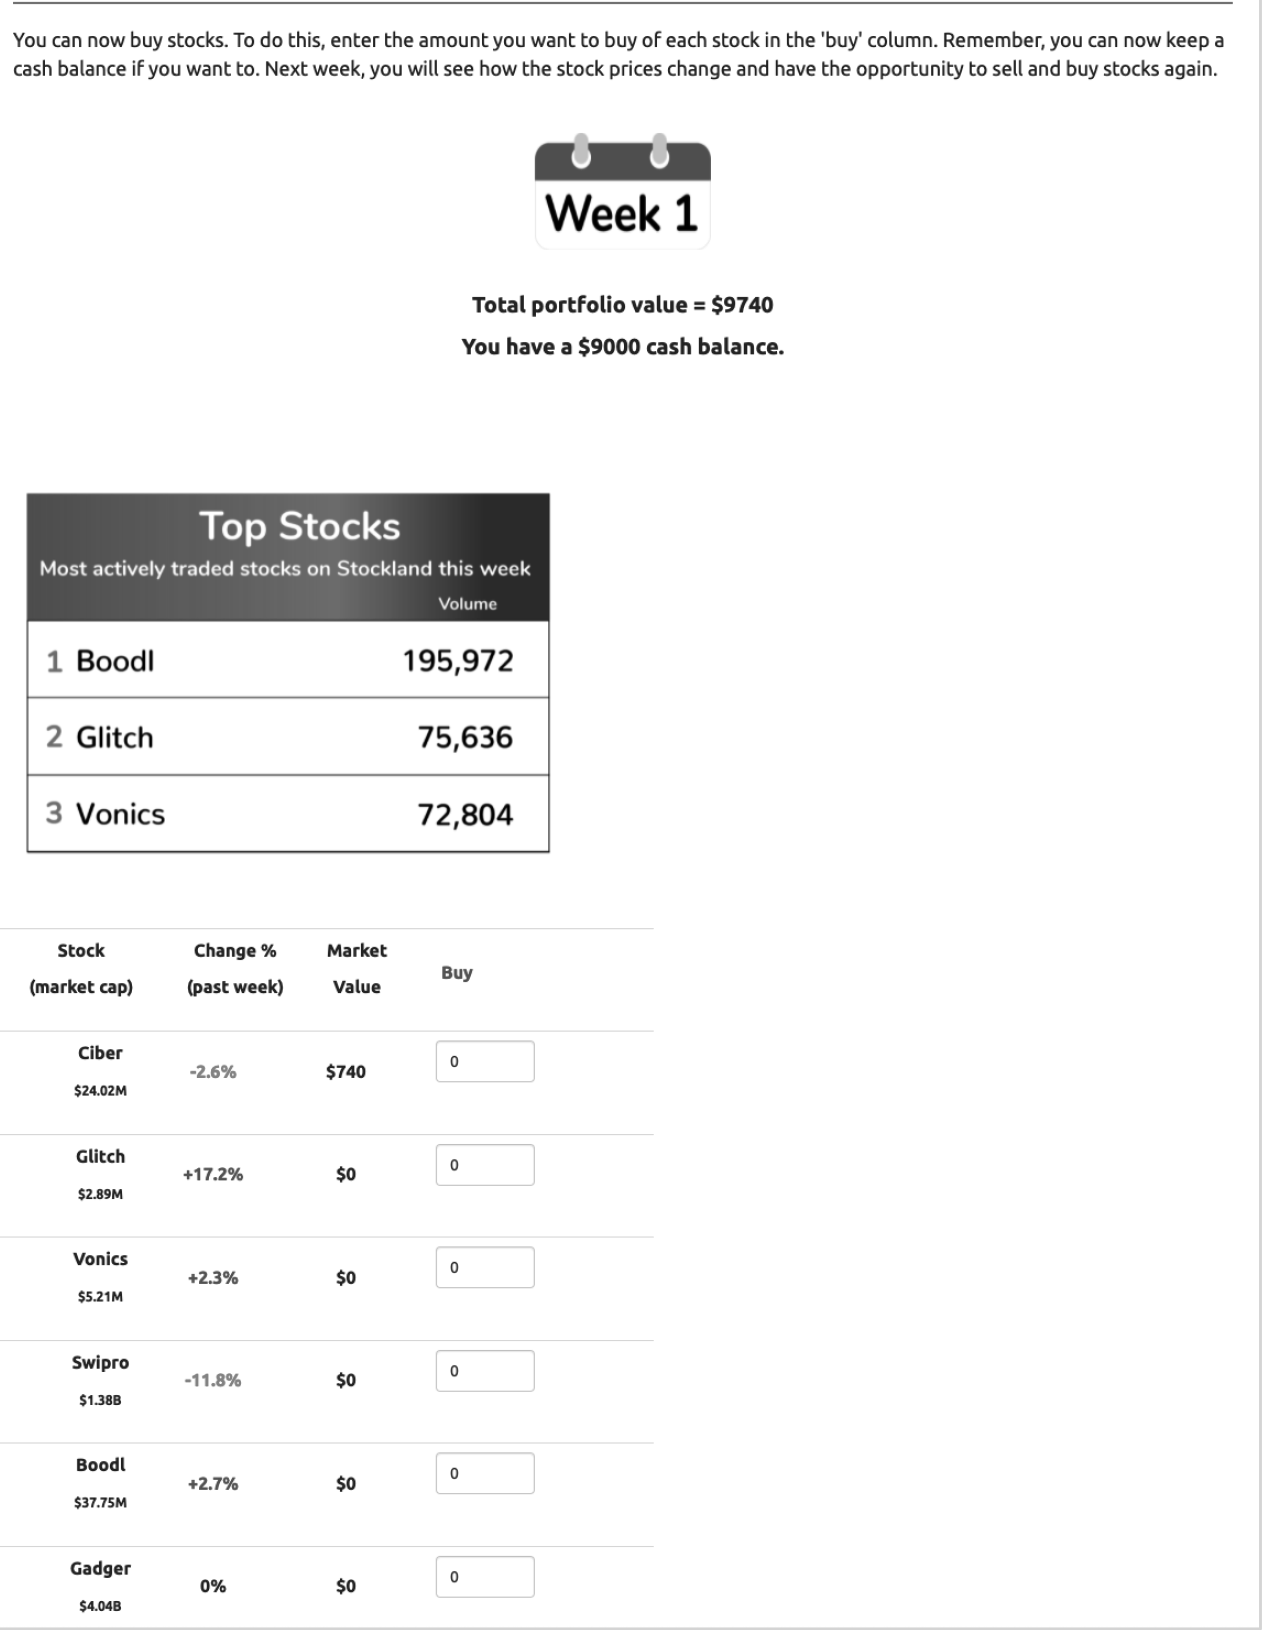
Adam, M., Roethke, K., & Benlian, A. (2021). Gamblified digital product offerings: an experimental study of loot box menu designs. Electronic Markets, 1-16.
Allcott, H., & Rogers, T. (2014). The short-run and long-run effects of behavioral interventions: Experimental evidence from energy conservation. American Economic Review, 104(10), 3003-37.
Arnold, M., Pelster, M., & Subrahmanyam, M. G. (2022). Attention triggers and investors' risk-taking. Journal of Financial Economics, 143(2), 846-875.
Auer, M. M., & Griffiths, M. D. (2016). Personalized behavioral feedback for online gamblers: A real world empirical study. Frontiers in Psychology, 1875.
Ayton, P., & Fischer, I. (2004). The hot hand fallacy and the gambler's fallacy: Two faces of subjective randomness?. Memory & cognition, 32(8), 1369-1378.
Bali, T. G., Hirshleifer, D., Peng, L., & Tang, Y. (2021). Attention, social interaction, and investor attraction to lottery stocks (No. w29543). National Bureau of Economic Research.
Barber, B. M., & Odean, T. (2000). Trading is hazardous to your wealth: The common stock investment performance of individual investors. Journal of Finance, 55(2), 773-806.
Barber, B. M., Huang, X., Odean, T., & Schwarz, C. (2020). Attention induced trading and returns: Evidence from Robinhood users. Journal of Finance (Forthcoming). SSRN 3715077.
Behavioral Insights Team. (2014). EAST: Four simple ways to apply behavioural insights. Retrieved from: https://www.bi.team/wp-content/uploads/2015/07/BIT-Publication-EAST_FA_WEB.pdf
Bettinger, E. P., Long, B. T., Oreopoulos, P., & Sanbonmatsu, L. (2012). The role of application assistance and information in college decisions: Results from the H&R Block FAFSA experiment. The Quarterly Journal of Economics, 127(3), 1205-1242.
Biais, B., Hilton, D., Mazurier, K., & Pouget, S. (2005). Judgemental overconfidence, self-monitoring, and trading performance in an experimental financial market. The Review of Economic Studies, 72(2), 287-312.
Burns, Z., Chiu, A., & Wu, G. (2010). Overweighting of small probabilities. In Wiley Encyclopedia of Operations Research and Management Science (pp. 1-8). Hoboken, NJ, USA: John Wiley & Sons.
Cara, C. (2019). Dark patterns in the media: A systematic review. Network Intelligence Studies, 7(14), 105-113.
Carver, C. S., & Scheier, M. F. (2012). Attention and self-regulation: A control-theory approach to human behavior. Springer Science & Business Media.
Ceschi, A., Sartori, R., Dickert, S., Scalco, A., Tur, E. M., Tommasi, F., & Delfini, K. (2021). Testing a norm-based policy for waste management: An agent-based modeling simulation on nudging recycling behavior. Journal of Environmental Management, 294, 112938.
Chapkovski, P., Khapko, M., & Zoican, M. (2021). Does gamified trading stimulate risk taking?. SSRN 3971868.
Chang, T. Y., Solomon, D. H., & Westerfield, M. M. (2016). Looking for someone to blame: Delegation, cognitive dissonance, and the disposition effect. The Journal of Finance, 71(1), 267-302.
Chaudhry, S., & Kulkarni, C. (2021, June). Design Patterns of Investing Apps and Their Effects on Investing Behaviors. In Designing Interactive Systems Conference 2021 (pp. 777-788).
Croson, R., & Sundali, J. (2005). The gambler's fallacy and the hot hand: Empirical data from casinos. Journal of Risk and Uncertainty, 30(3), 195-209.
Cutts, J. (2021, Sep 14). "Not all brokerages should 'gamify' a la Robinhood -- but others can/will go further." Traders Magazine.
De Groot, J. I., Abrahamse, W., & Jones, K. (2013). Persuasive normative messages: The influence of injunctive and personal norms on using free plastic bags. Sustainability, 5(5), 1829-1844.
Dorn, A. J., Dorn, D., & Sengmueller, P. (2015). Trading as gambling. Management Science, 61(10), 2376-2393.
Ebert, N., Alexander Ackermann, K., & Scheppler, B. (2021, May). Bolder is better: Raising user awareness through salient and concise privacy notices. In Proceedings of the 2021 CHI Conference on Human Factors in Computing Systems (pp. 1-12).
Egli, M., Schaal, D. W., Thompson, T., & Cleary, J. (1992). Opioid-induced response-rate decrements in pigeons responding under variable-interval schedules: reinforcement mechanisms. Behavioural Pharmacology.
Fazio, L. (2020). Pausing to consider why a headline is true or false can help reduce the sharing of false news. Harvard Kennedy School Misinformation Review, 1(2).
Fenton-O'Creevy, M., Adam, M., Clough, G., Conole, G., Gaved, M., Lins, J. T., et al. (2015). A game based approach to improve traders' decision-making. In: The International Gamification for Business Conference 2015: Strategic Industrial Applications of Games and Gamification.
FINRA (2021, Jun 30). "FINRA Requests Comment on Effective Methods to Educate Newer Investors". Retrieved from: https://www.finra.org/rules-guidance/notices/special-notice-063021#comments
Frydman, C., & Wang, B. (2020). The impact of salience on investor behavior: Evidence from a natural experiment. Journal of Finance, 75(1), 229-276.
Grieve, R. & Lowe-Calverley, E. (2016, Jul 16). The power of rewards and why we seek them out. The Conversation.
Griffiths, M., & Wood, R. (2001). The psychology of lottery gambling. International Gambling Studies, 1(1), 27-45.
Hamari, J., Koivisto, J., & Sarsa, H. (2014, January). Does gamification work?--a literature review of empirical studies on gamification. In 2014 47th Hawaii international conference on system sciences (pp. 3025-3034).
Hamari, J. (2017). Do badges increase user activity? A field experiment on the effects of gamification. Computers in Human Behavior, 71, 469-478.
Haw, J. (2008). Random-ratio schedules of reinforcement: The role of early wins and unreinforced trials. Journal of Gambling Issues, (21), 56-67.
Hou, Y., Xiong, D., Jiang, T., Song, L., & Wang, Q. (2019). Social media addiction: Its impact, mediation, and intervention. Cyberpsychology: Journal of psychosocial research on cyberspace, 13(1).
Hswen, Y., Murti, V., Vormawor, A. A., Bhattacharjee, R., & Naslund, J. A. (2013). Virtual avatars, gaming, and social media: Designing a mobile health app to help children choose healthier food options. Journal of mobile technology in medicine, 2(2), 8.
Huynh, D., & Iida, H. (2017). An Analysis of Winning Streak's Effects in Language Course of "Duolingo". University Kebangsaan Malaysia Press.
Investment Industry Regulatory Organization of Canada -- IIROC (2019, Apr 9). "Guidance on Order Execution Only Services and Activities". Retrieved from: https://www.iiroc.ca/news-and-publications/notices-and-guidance/guidance-order-execution-only-services-and-activities
Jacobson, L. & Tamakloe, K. S. (2021, Aug 19). "Have vaccine lotteries worked? Studies so far show mixed results". Politifact.
Johnson, E. J., Shu, S. B., Dellaert, B. G., Fox, C., Goldstein, D. G., Häubl, G., & Weber, E. U. (2012). Beyond nudges: Tools of a choice architecture. Marketing Letters, 23(2), 487-504.
Johnson, D., Deterding, S., Kuhn, K. A., Staneva, A., Stoyanov, S., & Hides, L. (2016). Gamification for health and wellbeing: A systematic review of the literature. Internet interventions, 6, 89-106.
Kalda, A., Loos, B., Previtero, A., & Hackethal, A. (2021). Smart (Phone) Investing? A within Investor-time Analysis of New Technologies and Trading Behavior (No. w28363). National Bureau of Economic Research.
Kellner, C., Reinstein, D., & Riener, G. (2019). Ex-ante commitments to "give if you win" exceed donations after a win. Journal of Public Economics, 169, 109-127.
Kesel, W. (2020, Apr 1). 3 Avatar-Based Virtual Event Platforms for Planners to Consider. BizBash.com
Kluger, A. N., & DeNisi, A. (1996). The effects of feedback interventions on performance: A historical review, a meta-analysis, and a preliminary feedback intervention theory. Psychological Bulletin, 119(2), 254.
Kivetz, R., Urminsky, O., & Zheng, Y. (2006). The goal-gradient hypothesis resurrected: Purchase acceleration, illusionary goal progress, and customer retention. Journal of Marketing Research, 43(1), 39-58.
Koo, M., & Fishbach, A. (2012). The small-area hypothesis: Effects of progress monitoring on goal adherence. Journal of Consumer Research, 39(3), 493-509.
Krause, M., Mogalle, M., Pohl, H., & Williams, J. J. (2015). "A playful game changer: Fostering student retention in online education with social gamification". In Proceedings of the Second ACM conference on Learning@Scale (pp. 95-102).
Lagorio, C. H., & Winger, G. (2014). Random-ratio schedules produce greater demand for iv drug administration than fixed-ratio schedules in rhesus monkeys. Psychopharmacology, 231(15), 2981-2988.
Liu, Y. Y., Nacher, J. C., Ochiai, T., Martino, M., & Altshuler, Y. (2014). Prospect theory for online financial trading. PloS one, 9(10), e109458.
Lyft (2022). "Streak Bonus". Retrieved from: https://help.lyft.com/hc/e/articles/115015748908-Streak-Bonus
Leibbrandt, A., Gneezy, U., & List, J. A. (2013). Rise and fall of competitiveness in individualistic and collectivistic societies. Proceedings of the National Academy of Sciences, 110(23), 9305-9308.
Lewis, L. K., Rowlands, A. V., Gardiner, P. A., Standage, M., English, C., & Olds, T. (2016). Small steps: preliminary effectiveness and feasibility of an incremental goal-setting intervention to reduce sitting time in older adults. Maturitas, 85, 64-70.
Looyestyn, J., Kernot, J., Boshoff, K., Ryan, J., Edney, S., & Maher, C. (2017). Does gamification increase engagement with online programs? A systematic review. PloS one, 12(3), e0173403.
Mehra, A., Paul, J., & Kaurav, R. P. S. (2021). Determinants of mobile apps adoption among young adults: theoretical extension and analysis. Journal of Marketing Communications, 27(5), 481-509.
Mekler, E. D., Brühlmann, F., Opwis, K., & Tuch, A. N. (2013, October). Do points, levels and leaderboards harm intrinsic motivation? An empirical analysis of common gamification elements. In Proceedings of the First International Conference on gameful design, research, and applications (pp. 66-73).
Miltenberger, R. G. (2008). "Behavioral Modification: Principles and Procedures". Florida, Thomson.
Montag, C., Markowetz, A., Blaszkiewicz, K., Andone, I., Lachmann, B., Sariyska, R., ... & Markett, S. (2017). Facebook usage on smartphones and gray matter volume of the nucleus accumbens. Behavioural brain research, 329, 221-228.
Morschheuser, B., & Hamari, J. (2019). The gamification of work: Lessons from crowdsourcing. Journal of Management Inquiry, 28(2), 145-148.
Kundisch, D., & von Rechenberg, T. (2017). Does the framing of progress towards virtual rewards matter?. Business & Information Systems Engineering, 59(4), 207-222.
Nah, F. F. H., Zeng, Q., Telaprolu, V. R., Ayyappa, A. P., & Eschenbrenner, B. (2014, June). Gamification of education: a review of literature. In International conference on hci in business (pp. 401-409). Springer, Cham.
Odean, T. (1999). Do investors trade too much? American economic review, 89(5), 1279-1298.
Powell, L. (2021, September 14). SEC Investor Advisory Committee examines digital engagement practices [Blog post]. Retrieved from https://jimhamiltonblog.blogspot.com/2021/09/sec-investor-advisory-committee_14.html
Rodrigues, L. F., Oliveira, A., & Costa, C. J. (2016). Does ease-of-use contributes to the perception of enjoyment? A case of gamification in e-banking. Computers in Human Behavior, 61, 114-126.
Scheiber, N. (2017, Apr 2). How Uber Uses Psychological Tricks to Push Its Drivers' Buttons. New York Times. Retrieved from: https://www.nytimes.com/interactive/2017/04/02/technology/uber-drivers-psychological-tricks.html
Sherif, M. (1935). A study of some social factors in perception. Archives of Psychology, 27: 187.
Sherman, L. E., Hernandez, L. M., Greenfield, P. M., & Dapretto, M. (2018). What the brain 'Likes': neural correlates of providing feedback on social media. Social cognitive and affective neuroscience, 13(7), 699-707.
Shull, R. L., & Grimes, J. A. (2006). Resistance to extinction following variable-interval reinforcement: Reinforcer rate and amount. Journal of the Experimental Analysis of Behavior, 85(1), 23-39.
Skinner, B.F. (1969). Contingencies of reinforcement: A theoretical analysis. Meredith Corporation.
Sparkman, G., & Walton, G. M. (2017). Dynamic norms promote sustainable behavior, even if it is counternormative. Psychological science, 28(11), 1663-1674.
Song, H., Kim, J., Tenzek, K. E., & Lee, K. M. (2010, June). The effects of competition on intrinsic motivation in exergames and the conditional indirect effects of presence. In Annual Conference of the International Communication Association, Singapore.
Thaler, R. H., & Johnson, E. J. (1990). Gambling with the house money and trying to break even: The effects of prior outcomes on risky choice. Management science, 36(6), 643-660.
Tobon, S., Ruiz-Alba, J. L., & García-Madariaga, J. (2020). Gamification and online consumer decisions: Is the game over? Decision Support Systems, 128, 113167.
Tuah, N. M., Yoag, A., Ahmedy, F., & Baharum, A. (2019). A gamification and avatar self-representation application for diabetes self-management. Int. J. Adv. Trends Comput. Sci. Eng, 8, 401-407.
Uber (2022). "How does the Consecutive Trips promotion work?" Retrieved from: https://help.uber.com/driving-and-delivering/article/how-does-the-consecutive-trips-promotion-work?nodeId=de983305-076a-40cf-aaf4-7b23f50a0007.
U.S. Securities and Exchange Commission (2021, Aug. 27). "SEC Requests Information and Comment on Broker-Dealer and Investment Adviser Digital Engagement Practices, Related Tools and Methods, and Regulatory Considerations and Potential Approaches; Information and Comments on Investment Adviser Use of Technology." Retrieved from: https://www.sec.gov/news/press-release/2021-167
U.S. Securities and Exchange Commission (n.d.). "Request for Information and Comments on Broker-Dealer and Investment Adviser Digital Engagement Practices, Related Tools and Methods, and Regulatory Considerations and Potential Approaches...". Retrieved from: https://business.cch.com/srd/34-92766.pdf
Van Osselaer, S. M., Alba, J. W., & Manchanda, P. (2004). Irrelevant information and mediated intertemporal choice. Journal of Consumer Psychology, 14(3), 257-270.
Wisniewski, B., Zierer, K., & Hattie, J. (2020). The power of feedback revisited: A meta-analysis of educational feedback research. Frontiers in Psychology, 10, 3087.
Ontario Securities Commission -- Investor Office Research and Behavioural Insights Team (IORBIT) |
Behavioural Insights Team (BIT) |
Tyler Fleming |
Sasha Tregebov |
Director, Investor Office |
Director, BIT Canada |
tfleming@osc.gov.on.ca |
sasha.tregebov@bi.team |
Marian Passmore |
Report Contributors: |
Senior Advisor, Policy |
Sebastian Salomon-Ballada |
mpassmore@osc.gov.on.ca |
Senior Advisor |
Matthew Kan |
Laura Callender |
Senior Advisor, Behavioural Insights |
Advisor |
mkan@osc.gov.on.ca |
|
November 11, 2022
The principal regulator in the Jurisdiction has received an application from the Filer for an order under the securities legislation of the Jurisdiction of the principal regulator (the Legislation) that the Filer has ceased to be a reporting issuer in all jurisdictions of Canada in which it is a reporting issuer (the Order Sought).
Under the Process for Cease to be a Reporting Issuer Applications (for a passport application):
(a) the Ontario Securities Commission is the principal regulator for this application, and
(b) the Filer has provided notice that subsection 4C.5(1) of Multilateral Instrument 11-102 Passport System (MI 11-102) is intended to be relied upon in all provinces and territories of Canada other than Ontario.
Terms defined in National Instrument 14-101 Definitions and MI 11-102 have the same meaning if used in this order, unless otherwise defined.
This order is based on the following facts represented by the Filer:
1. The Filer is not an OTC reporting issuer under Multilateral Instrument 51-105Issuers Quoted in the U.S. Over-the-Counter Markets;
2. The outstanding securities of the Filer, including debt securities, are beneficially owned, directly or indirectly, by fewer than 15 securityholders in Ontario and fewer than 51 securityholders in total worldwide;
3. No securities of the Filer, including debt securities, are traded in Canada or another country on a marketplace as defined in National Instrument 21-101 Marketplace Operation or any other facility for bringing together buyers and sellers of securities where trading data is publicly reported;
4. the Filer is applying for an order that the Filer has ceased to be a reporting issuer in all of the jurisdictions of Canada in which it is a reporting issuer; and
5. The Filer is not in default of securities legislation in any jurisdiction.
The principal regulator is satisfied that the order meets the test set out in the Legislation for the principal regulator to make the order.
The decision of the principal regulator under the Legislation is that the Order Sought is granted.
Evermore Capital Inc. and the Funds
National Policy 11-203 Process for Exemptive Relief Applications in Multiple Jurisdictions -- Relief granted to ETFs for extension of lapse date of their prospectus -- Filer will incorporate offering of the ETFs under the same offering documents when they are renewed -- Extensions of lapse date will not affect the currency or accuracy of the information contained in the current prospectus.
Securities Act, R.S.O. 1990, c. S.5, as am., ss. 62(5).
November 9, 2022
The principal regulator in the Jurisdiction has received an application from the Filer on behalf of the Funds for a decision under the securities legislation of the Jurisdiction (the Legislation) that the time limit for the renewal of the long form prospectus of the Funds dated February 11, 2022 (the Prospectus) be extended to those time limits that would apply if the lapse date of the Prospectus were May 23, 2023 (the Exemption Sought).
Under the Process for Exemptive Relief Applications in Multiple Jurisdictions (for a passport application):
(i) the Ontario Securities Commission is the principal regulator for this application; and
(ii) the Filer has provided notice that subsection 4.7(1) of Multilateral Instrument 11-102 Passport System (MI 11-102) is intended to be relied upon in each of the other provinces and territories of Canada (together with Ontario, the Jurisdictions).
Terms defined in National Instrument 14-101 Definitions and MI 11-102 have the same meaning if used in this decision, unless otherwise defined.
This decision is based on the following facts represented by the Filer:
1. The Filer is a corporation incorporated under the laws of Canada. The Filer's head office is located in Toronto, Ontario.
2. The Filer is registered as an investment fund manager in Ontario, Québec and Newfoundland and Labrador and as a portfolio manager in Ontario. The Filer is the investment fund manager of the Funds.
3. Each of the Funds is an exchange-traded mutual fund (ETF) established under the laws of Ontario, and is a reporting issuer as defined in the securities legislation of each of the Jurisdictions.
4. Neither the Filer nor any of the Funds are in default of securities legislation in any of the Jurisdictions.
5. The Funds currently distribute securities in the Jurisdictions under the Prospectus. Securities of each of the Funds trade on the Neo Exchange Inc.
6. Pursuant to subsection 62(1) of the Securities Act (Ontario) (the Act), the lapse date of the Prospectus is February 11, 2023 (the Lapse Date). Accordingly, under subsection 62(2) of the Act, the distribution of securities of the Funds would have to cease on the Lapse Date unless: (i) the Funds file a pro forma prospectus at least 30 days prior to the Lapse Date; (ii) the final prospectus is filed no later than 10 days after the Lapse Date; and (iii) a receipt for the final prospectus is obtained within 20 days of the Lapse Date.
7. Pursuant to subsections 10.1(1), 10.1(1.1) and 10.1(2) of National Instrument 41-101 General Prospectus Requirements (NI 41-101), the Funds must file a written consent provided by their auditor no later than February 21, 2023, 10 days after the Lapse Date.
8. The fiscal year-end of each Fund is December 31 and, pursuant to section 2.2 of National Instrument 81-106 Investment Fund Continuous Disclosure, the annual financial statements and auditor's report are required to be filed on or before the 90th day after each Fund's most recently completed financial year, which for each Fund will be its financial year-end of December 31, 2022 (the 2022 Fiscal Year-End).
9. Pursuant to section 4.3(1) of NI 41-101 and given the 2022 Fiscal Year-End, the Funds' auditor will be required to review the Funds' unaudited interim financial statements for the period ended June 30, 2022.
10. The Filer must file annual financial statements for the Funds for the 2022 Fiscal Year-End by no later than March 31, 2023, which date is after the Lapse Date.
11. As audited financial statements will not be ready by the Lapse Date, the Funds will need to incorporate by reference unaudited interim financial information (as at June 30, 2022) into the final long form prospectus for the Funds. In order to incorporate by reference the interim unaudited financial statements into the final long form prospectus for the Funds, those interim unaudited financial statements must be reviewed by the Funds' auditor in accordance with the relevant standards set out in the Handbook of the Canadian Institute of Chartered Accountants for a review of financial statements.
12. Given that the audited financial statements of the Funds will be available no later than March 31, 2023, which is only a few weeks following the filing of the final long form prospectus for the Funds pursuant to the Lapse Date, this review of the interim unaudited financial statements will incur time and expenses which will only be relevant for a short period of time.
13. Extending the Funds' Lapse Date to May 23, 2023 will provide the time necessary for the Funds' auditor to complete the audit of the Funds' financial statements for the 2022 Fiscal Year-End and provide its written consent as required by NI 41-101, and enable the Filer to renew then Prospectus and ETF facts document in respect of the Funds on a timeline that allows the inclusion of the most current audited financial information each year. In doing so, it will be more efficient and remove unnecessary financial burden on the Funds which is indirectly borne by the Funds' securityholders.
14. There have been no material changes in the affairs of each Fund since the date of the Prospectus. Accordingly, the Prospectus and current ETF facts document of each Fund represent current information regarding such Fund.
15. Given the disclosure obligations of the Funds, should any material change occur, the Prospectus and current ETF facts document(s) in respect of the applicable Fund(s) will be amended as required under the Legislation.
16. New investors in the Funds will receive delivery of the most recently filed ETF facts document of the applicable Fund(s). The Prospectus will remain available upon request.
17. The Exemption Sought will not affect the accuracy of the information contained in the Prospectus or the ETF facts document(s) of each Fund and will therefore not be prejudicial to the public interest.
The principal regulator is satisfied that the decision meets the test set out in the Legislation for the principal regulator to make the decision.
The decision of the principal regulator under the Legislation is that the Exemption Sought is granted.
Evermore Retirement 2025 ETF
Evermore Retirement 2030 ETF
Evermore Retirement 2035 ETF
Evermore Retirement 2040 ETF
Evermore Retirement 2045 ETF
Evermore Retirement 2050 ETF
Evermore Retirement 2055 ETF
Evermore Retirement 2060 ETF
National Policy 11-203 Process for Exemptive Relief Applications in Multiple Jurisdictions -- Relief from the formal valuation and minority approval requirements in Multilateral Instrument 61-101 Protection of Minority Security Holders in Special Transactions -- issuer is a special purpose acquisition corporation that will have no operations and generate no operating revenues until it completes its qualifying acquisition -- issuer's authorized capital consists of class A restricted voting shares which are entitled to be redeemed at the election of the holder prior to the completion of the qualifying acquisition for an amount equivalent to their initial investment, and class B shares that do not have any redemption rights but which have the residual right to share in the assets of the issuer on liquidation or dissolution -- the entirety of the gross proceeds from the initial public offering of the class A restricted voting shares were put into an escrow account to be used to, among other things, satisfy any redemptions in respect of the restricted voting shares and fund the qualifying acquisition -- the class B shares do not have access to, and cannot benefit from, the funds in the escrow account -- only the class A restricted voting shares are listed and posted for trading on an exchange -- relief granted subject to conditions, including that the related party transaction constituting the issuer's qualifying acquisition would qualify for the 25% market capitalization exemption if the class A restricted voting shares represented all of the outstanding equity securities of the issuer.
November 14, 2022
The principal regulator in the Jurisdiction has received an application from the Filer for a decision under the securities legislation of the Jurisdiction of the principal regulator (the "Legislation") that the Filer be granted an exemption pursuant to section 9.1 of Multilateral Instrument 61-101 Protection of Minority Security Holders in Special Transactions ("MI 61-101") from the minority approval and formal valuation requirements under Part 5 of MI 61-101 in respect of the Proposed Transaction (as defined below), which transaction constitutes a related party transaction for the purposes of MI 61-101 (the "Exemption Sought").
Under the Process for Exemptive Relief Applications in Multiple Jurisdictions (for a passport application):
(a) the Ontario Securities Commission is the principal regulator for this application; and
(b) the Filer has provided notice that section 4.7(1) of Multilateral Instrument 11-102 Passport System ("MI 11-102") is intended to be relied upon in Alberta, Manitoba, and New Brunswick.
Terms defined in National Instrument 14-101 Definitions, MI 11-102 and MI 61-101 have the same meaning if used in this decision, unless otherwise defined. For the purpose of this decision, the following terms have the meaning ascribed to them:
"qualifying acquisition" shall have the meaning ascribed to such term in the TSX Company Manual;
"Redemption Price" shall mean an amount per share equal to the pro-rata portion of: (a) the Escrowed Funds, including interest and other amounts earned thereon; less (b) an amount equal to the total of (i) applicable taxes payable by the Filer on such interest and other amounts earned in the Filer's escrow account, and (ii) actual and expected direct expenses related to the redemption, each as reasonably determined by the Filer;
"SPAC" shall mean a special purpose acquisition corporation;
"TSX" shall mean the Toronto Stock Exchange; and
"Winding-Up Redemption Price" shall mean an amount per share equal to the pro-rata portion of: (a) the Escrowed Funds, including any interest and other amounts earned thereon; less (b) an amount equal to the total of (i) any applicable taxes payable by the Filer on such interest and other amounts earned in the Filer's escrow account, and (ii) any taxes of the Filer arising in connection with the redemption of the Class A Restricted Voting Shares, and (iii) up to a maximum of U.S. $50,000 of interest and other amounts earned to pay actual and expected winding-up expenses and certain other related costs, each as reasonably determined by the Filer.
This decision is based on the following facts represented by the Filer:
1. The Filer is a SPAC existing under and governed by the laws of the Province of British Columbia. The Filer was formed for the purpose of effecting its qualifying acquisition pursuant to the acquisition of one or more businesses or assets, by way of a merger, amalgamation, arrangement, share exchange, asset acquisition, share purchase, reorganization, or any other similar business combination involving the Filer. From the time of the Filer's initial public offering (the "IPO") and until such time as the Filer completes its qualifying acquisition, the Filer has not had any operations and has generated no operating revenues.
2. The Filer's head office is located at 161 Bay Street, Suite 2420, Toronto, Ontario, Canada, M5J 2S1.
3. The Filer is a reporting issuer (or the equivalent thereof) in each of the provinces and territories of Canada (other than Quebec) and is not in default of securities legislation in any jurisdiction.
4. The authorized capital of the Filer consists of an unlimited number of Class A restricted voting shares (the "Class A Restricted Voting Shares"), an unlimited number of Class B shares (the "Class B Shares"), an unlimited number of common shares (the "Common Shares") and an unlimited number of proportionate voting shares (the "Proportionate Voting Shares"). As of October 31, 2022, the Filer has 10,000,000 Class A Restricted Voting Shares issued and outstanding, and 2,937,500 Class B Shares issued and outstanding.
5. The Class A Restricted Voting Shares comprised part of the Class A restricted voting units ("Class A Restricted Voting Units") offered to the public pursuant to the final long form prospectus of the Filer dated February 23, 2021. The Class B Shares were issued to the Filer's sponsors, VM HA Sponsor Corp. and VM HA Sponsor LP (together, the "Sponsors"), and certain third parties in connection with the Filer's IPO. The Filer also has 5,175,000 warrants outstanding, 5,000,000 of which formed part of the Class A Restricted Voting Units that were sold to the public in its IPO, and 175,000 of which formed part of the Class B units ("Class B Units") that were sold to the Sponsors and certain third parties in connection with its IPO. Each warrant entitles the holder to purchase one Class A Restricted Voting Share of the Filer at a price of $11.50, subject to anti-dilution adjustments, during the period commencing 65 days after the completion of the qualifying acquisition and ending five years after the completion of the qualifying acquisition. As of October 31, 2022, the Sponsors hold 2,545,500 Class B Shares, representing approximately 87% of the outstanding Class B Shares and approximately 20% of the aggregate Class A Restricted Voting Shares and Class B Shares outstanding.
6. The entirety of the gross proceeds from the Class A Restricted Voting Shares offered under the IPO were put into the Filer's escrow account (the "Escrowed Funds") to be used to, inter alia, satisfy the payment of the Redemption Price due to holders of Class A Restricted Voting Shares upon the exercise of the redemption right attached to the Class A Restricted Voting Shares, and fund the qualifying acquisition. Any Escrowed Funds which are not used to consummate the qualifying acquisition will be disbursed to the Filer and will, along with any other amounts not expended prior to the consummation of the qualifying acquisition, be used to fund general ongoing expenses.
7. Provided that holders of Class A Restricted Voting Shares adhere to the specified timing requirements, such holders are entitled to redeem all or a portion of their Class A Restricted Voting Shares, whether they vote for or against, or do not vote on, the qualifying acquisition for the Redemption Price per Class A Restricted Voting Share. Upon the closing of the qualifying acquisition, any Class A Restricted Voting Shares that are not redeemed will be automatically converted into Common Shares on the basis of one Common Share for each Class A Restricted Voting Share converted, and any Class B Shares will be automatically converted on a 100-for-1 basis into Proportionate Voting Shares.
8. The net proceeds from the issuance of the Class B Units and Class B Shares were not put into the Filer's escrow account, and may be used towards the Filer's general ongoing expenses and funding the identification and completion of a qualifying acquisition.
9. The holders of Class B Shares do not have access to, and cannot benefit from, the Escrowed Funds, and accordingly, do not have any redemption rights.
10. The Redemption Price is payable in cash from the Escrowed Funds, and upon such payment, the holders of Class A Restricted Voting Shares will have no further rights in respect of the Class A Restricted Voting Shares.
11. The Filer has entered into a business combination agreement with TCPI Mergersub, Inc., a wholly-owned subsidiary of the Filer, The Pyure Company Inc. ("Pyure") and HGI Industries, Inc., a predecessor and majority shareholder of Pyure, pursuant to which, among other things, the Filer will, indirectly through a series of transactions, acquire all of the issued and outstanding shares of Pyure (the "Proposed Transaction"). The Proposed Transaction would constitute the Filer's qualifying acquisition.
12. Tom Vukota (the "Senior Officer"), who currently serves as the Executive Chair and Corporate Secretary of the Filer, is a "related party" (as defined under MI 61-101) of the Filer and holds 145,000 stock options of Pyure (the "Options"). In addition, a corporation that is an "affiliated entity" (as defined under MI 61-101) of the Senior Officer, 1001 Investments Holdings Ltd. ("1001 Holdings") owns 3,200,000 Series 2 preferred shares of Pyure (the "Preferred Shares"), representing approximately 6.36% of the issued and outstanding shares of Pyure (on a non-diluted basis), which will be indirectly acquired by the Filer as part of the Proposed Transaction. The value of the purchase price attributable to related parties of the Filer, being the Senior Officer and 1001 Holdings, is equal to approximately $12,094,900 (the "Related Party Consideration"), being approximately $11,744,000 in respect of the Preferred Shares and $350,900 in respect of the Options.
13. The acquisition of shares of the Filer from the Senior Officer and 1001 Holdings constitutes a related party transaction under MI 61-101 that would require the Filer to obtain a formal valuation and minority approval (the "Minority Protections"), unless an exemption is available.
14. A related party transaction that is subject to MI 61-101 may be exempt from the Minority Protections if, at the time the transaction is agreed to, neither the fair market value of the subject matter of, nor the fair market value of the consideration for, the transaction, exceeds 25% of the issuer's market capitalization (the "Transaction Size Exemption").
15. The Filer may not be entitled to rely on the Transaction Size Exemption because the definition of market capitalization is calculated with reference to the aggregate market price of all outstanding equity securities of the Filer.
16. For the purposes of MI 61-101, an equity security is a security that carries a residual right to participate in the earnings of the issuer and, on liquidation or winding-up of the issuer, in its assets. The Class A Restricted Voting Shares do not have a residual right to share in the assets of the Filer on a liquidation or dissolution, as they are entitled only to receive an amount equal to the Winding-Up Redemption Price for each Class A Restricted Voting Share then outstanding. Prior to the completion of the qualifying acquisition, the residual right to share in the assets of the Filer on liquidation or dissolution rests with the Class B Shares.
17. The Class A Restricted Voting Shares are listed and posted for trading on the TSX under the trading symbol "VMH.U". The Class B Shares are not listed on any stock exchange and prior to the completion of a qualifying acquisition, are not transferable absent TSX consent. For the purposes of the TSX and public shareholders, the aggregate market value of the Class A Restricted Voting Shares represents the market capitalization of the Filer.
18. If the market capitalization of the Filer was calculated on the basis of the outstanding Class A Restricted Voting Shares representing all of the outstanding equity securities of the Filer, the Related Party Interest would represent approximately 12% of the Filer's market capitalization.
19. The Filer has included in the amended and restated material change report dated October 28, 2022 in connection with the Proposed Transaction, and will include in its non-offering prospectus in connection with the Proposed Transaction, a statement that it has applied for the Exemption Sought and a description of the substance and effects of the Exemption Sought, if granted.
The principal regulator is satisfied that the decision meets the test set out in the Legislation for the principal regulator to make the decision.
The decision of the principal regulator under the Legislation is that the Exemption Sought is granted provided that:
(a) the Proposed Transaction would qualify for the Transaction Size Exemption contained in MI 61-101 if the Class A Restricted Voting Shares represented all of the outstanding equity securities of the Filer, and
(b) any disclosure document provided to holders of Class A Restricted Voting Shares and Class B Shares, in connection with the Proposed Transaction includes a statement that the Filer has applied for, and been granted, the Exemption Sought, and a description of the substance and effects of the Exemption Sought.
Temporary, Permanent & Rescinding Issuer Cease Trading Orders
Company Name |
Date of Temporary Order |
Date of Hearing |
Date of Permanent Order |
Date of Lapse/Revoke |
|
||||
THERE IS NOTHING TO REPORT THIS WEEK. |
||||
Company Name |
Date of Order |
Date of Revocation |
|
||
Silver Bullet Mines Corp. |
November 8, 2022 |
November 10, 2022 |
Temporary, Permanent & Rescinding Management Cease Trading Orders
Company Name |
Date of Order |
Date of Lapse |
|
||
AION THERAPEUTIC INC. |
August 31, 2022 |
November 8, 2022 |
Outstanding Management & Insider Cease Trading Orders
Company Name |
Date of Order or Temporary Order |
Date of Hearing |
Date of Permanent Order |
Date of Lapse/Expire |
Date of Issuer Temporary Order |
|
|||||
Performance Sports Group Ltd. |
19 October 2016 |
31 October 2016 |
31 October 2016 |
__________ |
__________ |
Company Name |
Date of Order |
Date of Lapse |
|
||
Agrios Global Holdings Ltd. |
September 17, 2020 |
__________ |
|
||
Gatos Silver, Inc. |
April 1, 2022 |
__________ |
|
||
Gatos Silver, Inc. |
April 12, 2022 |
__________ |
|
||
Sproutly Canada, Inc. |
June 30, 2022 |
__________ |
|
||
Gatos Silver, Inc. |
July 7, 2022 |
__________ |
|
||
PlantX Life Inc. |
August 4, 2022 |
__________ |
|
||
AION THERAPEUTIC INC. |
August 31, 2022 |
November 8, 2022 |
|
||
iMining Technologies Inc. |
September 30, 2022 |
__________ |
Issuer Name:
Type and Date:
Offering Price and Description:
Underwriter(s) or Distributor(s):
Promoter(s):
Project #3446770
- - - - - - - - - - - - - - - - - - - - - - - - - - - - - - - - - - - - - - - - - - - - - - - - - -
Issuer Name:
Type and Date:
Offering Price and Description:
Underwriter(s) or Distributor(s):
Promoter(s):
Project #3455638
- - - - - - - - - - - - - - - - - - - - - - - - - - - - - - - - - - - - - - - - - - - - - - - - - -
Issuer Name:
Type and Date:
Offering Price and Description:
Underwriter(s) or Distributor(s):
Promoter(s):
Project #3335255
- - - - - - - - - - - - - - - - - - - - - - - - - - - - - - - - - - - - - - - - - - - - - - - - - -
Issuer Name:
Type and Date:
Offering Price and Description:
Underwriter(s) or Distributor(s):
Promoter(s):
Project #3387864
- - - - - - - - - - - - - - - - - - - - - - - - - - - - - - - - - - - - - - - - - - - - - - - - - -
Issuer Name:
Type and Date:
Offering Price and Description:
Underwriter(s) or Distributor(s):
Promoter(s):
Project #3454224
- - - - - - - - - - - - - - - - - - - - - - - - - - - - - - - - - - - - - - - - - - - - - - - - - -
Issuer Name:
Type and Date:
Offering Price and Description:
Underwriter(s) or Distributor(s):
Promoter(s):
Project #3420438
- - - - - - - - - - - - - - - - - - - - - - - - - - - - - - - - - - - - - - - - - - - - - - - - - -
Issuer Name:
Type and Date:
Offering Price and Description:
Underwriter(s) or Distributor(s):
Promoter(s):
Project #3456458
- - - - - - - - - - - - - - - - - - - - - - - - - - - - - - - - - - - - - - - - - - - - - - - - - -
Issuer Name:
Type and Date:
Offering Price and Description:
Underwriter(s) or Distributor(s):
Promoter(s):
Project #3453353
- - - - - - - - - - - - - - - - - - - - - - - - - - - - - - - - - - - - - - - - - - - - - - - - - -
Issuer Name:
Type and Date:
Offering Price and Description:
Underwriter(s) or Distributor(s):
Promoter(s):
Project #3447702
- - - - - - - - - - - - - - - - - - - - - - - - - - - - - - - - - - - - - - - - - - - - - - - - - -
Issuer Name:
Type and Date:
Offering Price and Description:
Underwriter(s) or Distributor(s):
Promoter(s):
Project #3420763
- - - - - - - - - - - - - - - - - - - - - - - - - - - - - - - - - - - - - - - - - - - - - - - - - -
Issuer Name:
Type and Date:
Offering Price and Description:
Underwriter(s) or Distributor(s):
Promoter(s):
Project #3452401
- - - - - - - - - - - - - - - - - - - - - - - - - - - - - - - - - - - - - - - - - - - - - - - - - -
Issuer Name:
Type and Date:
Offering Price and Description:
Underwriter(s) or Distributor(s):
Promoter(s):
Project #3456690
- - - - - - - - - - - - - - - - - - - - - - - - - - - - - - - - - - - - - - - - - - - - - - - - - -
Issuer Name:
Type and Date:
Offering Price and Description:
Underwriter(s) or Distributor(s):
Promoter(s):
Project #3448266
- - - - - - - - - - - - - - - - - - - - - - - - - - - - - - - - - - - - - - - - - - - - - - - - - -
Issuer Name:
Type and Date:
Offering Price and Description:
Underwriter(s) or Distributor(s):
Promoter(s):
Project #3418610
- - - - - - - - - - - - - - - - - - - - - - - - - - - - - - - - - - - - - - - - - - - - - - - - - -
Issuer Name:
Type and Date:
Offering Price and Description:
Underwriter(s) or Distributor(s):
Promoter(s):
Project #3448943
- - - - - - - - - - - - - - - - - - - - - - - - - - - - - - - - - - - - - - - - - - - - - - - - - -
Issuer Name:
Type and Date:
Offering Price and Description:
Underwriter(s) or Distributor(s):
Promoter(s):
Project #3436599
- - - - - - - - - - - - - - - - - - - - - - - - - - - - - - - - - - - - - - - - - - - - - - - - - -
Issuer Name:
Type and Date:
Offering Price and Description:
Underwriter(s) or Distributor(s):
Promoter(s):
Project #3421677
- - - - - - - - - - - - - - - - - - - - - - - - - - - - - - - - - - - - - - - - - - - - - - - - - -
Issuer Name:
Type and Date:
Offering Price and Description:
Underwriter(s) or Distributor(s):
Promoter(s):
Project #3439377
- - - - - - - - - - - - - - - - - - - - - - - - - - - - - - - - - - - - - - - - - - - - - - - - - -
Issuer Name:
Type and Date:
Offering Price and Description:
Underwriter(s) or Distributor(s):
Promoter(s):
Project #3416962
- - - - - - - - - - - - - - - - - - - - - - - - - - - - - - - - - - - - - - - - - - - - - - - - - -
Type |
Company |
Category of Registration |
Effective Date |
|
|||
New Registration |
GB Wealth Inc. |
Portfolio Manager and Commodity Trading Manager |
November 11, 2022 |